
Things Are Looking Brighter
For the month of May, stocks posted mixed results in a relatively volatile month of trading with the Dow and the S&P 500 gaining 1.9% and 0.6%, respectively, while tech-heavy Nasdaq, however, suffered a 1.5% loss. Leadership in the S&P 500 has been cyclical in May with energy and financials being the top performing sectors, returning 5.8% and 4.8% respectively. Consumer discretionary and technology sectors both lost grounds, posting negative returns of -3.8% and -0.9% respectively.
Much of the recent volatility was caused by investors’ concerns that the uptick in activities after reopening might generate a surge in inflation that might ultimately lead to less accommodative Fed’s policy. The headline CPI rose 4.2% YOY in April, with base effects contributing to some of the acceleration. Although the CPI rose more than expected by 0.8% on a monthly basis, the details highlight the transitory nature of the acceleration. On the demand side: the reopening of the economy and fiscal stimulus are two of the major drivers of some of the spikes in prices. We expect that labor scarcity and risks of wage inflation should ease later this year with the September expiration of COVID-related unemployment insurance programs and more people back to the labor market as infections decline.
The Fed’s April minutes released in the middle of the month reinforced that most committee members did not think tapering or rate hikes were needed in the near future, as “participants generally noted that the economy remained far from the Committee’s maximum-employment and price-stability goals”. We did noticed, however, that the Fed officials hinted for the first time “it might be appropriate at some point” to consider tapering asset purchases if the economy shows “rapid” progress.
Some macroeconomic and sentiment data softened slightly after record high levels last month, but we don’t believe this signals that the economy is moderating. The ISM manufacturing index fell from 64.7 in March to 60.7 in April, but it remains elevated and the outlook is favorable for factory conditions this quarter. Retail sales changed only marginally in April, but coming after the nearly unprecedented growth in March, it left the level of sales very high, and we believe that the overall trend of healthy consumer spending will continue with strong job growth and reduced restrictions on activities.
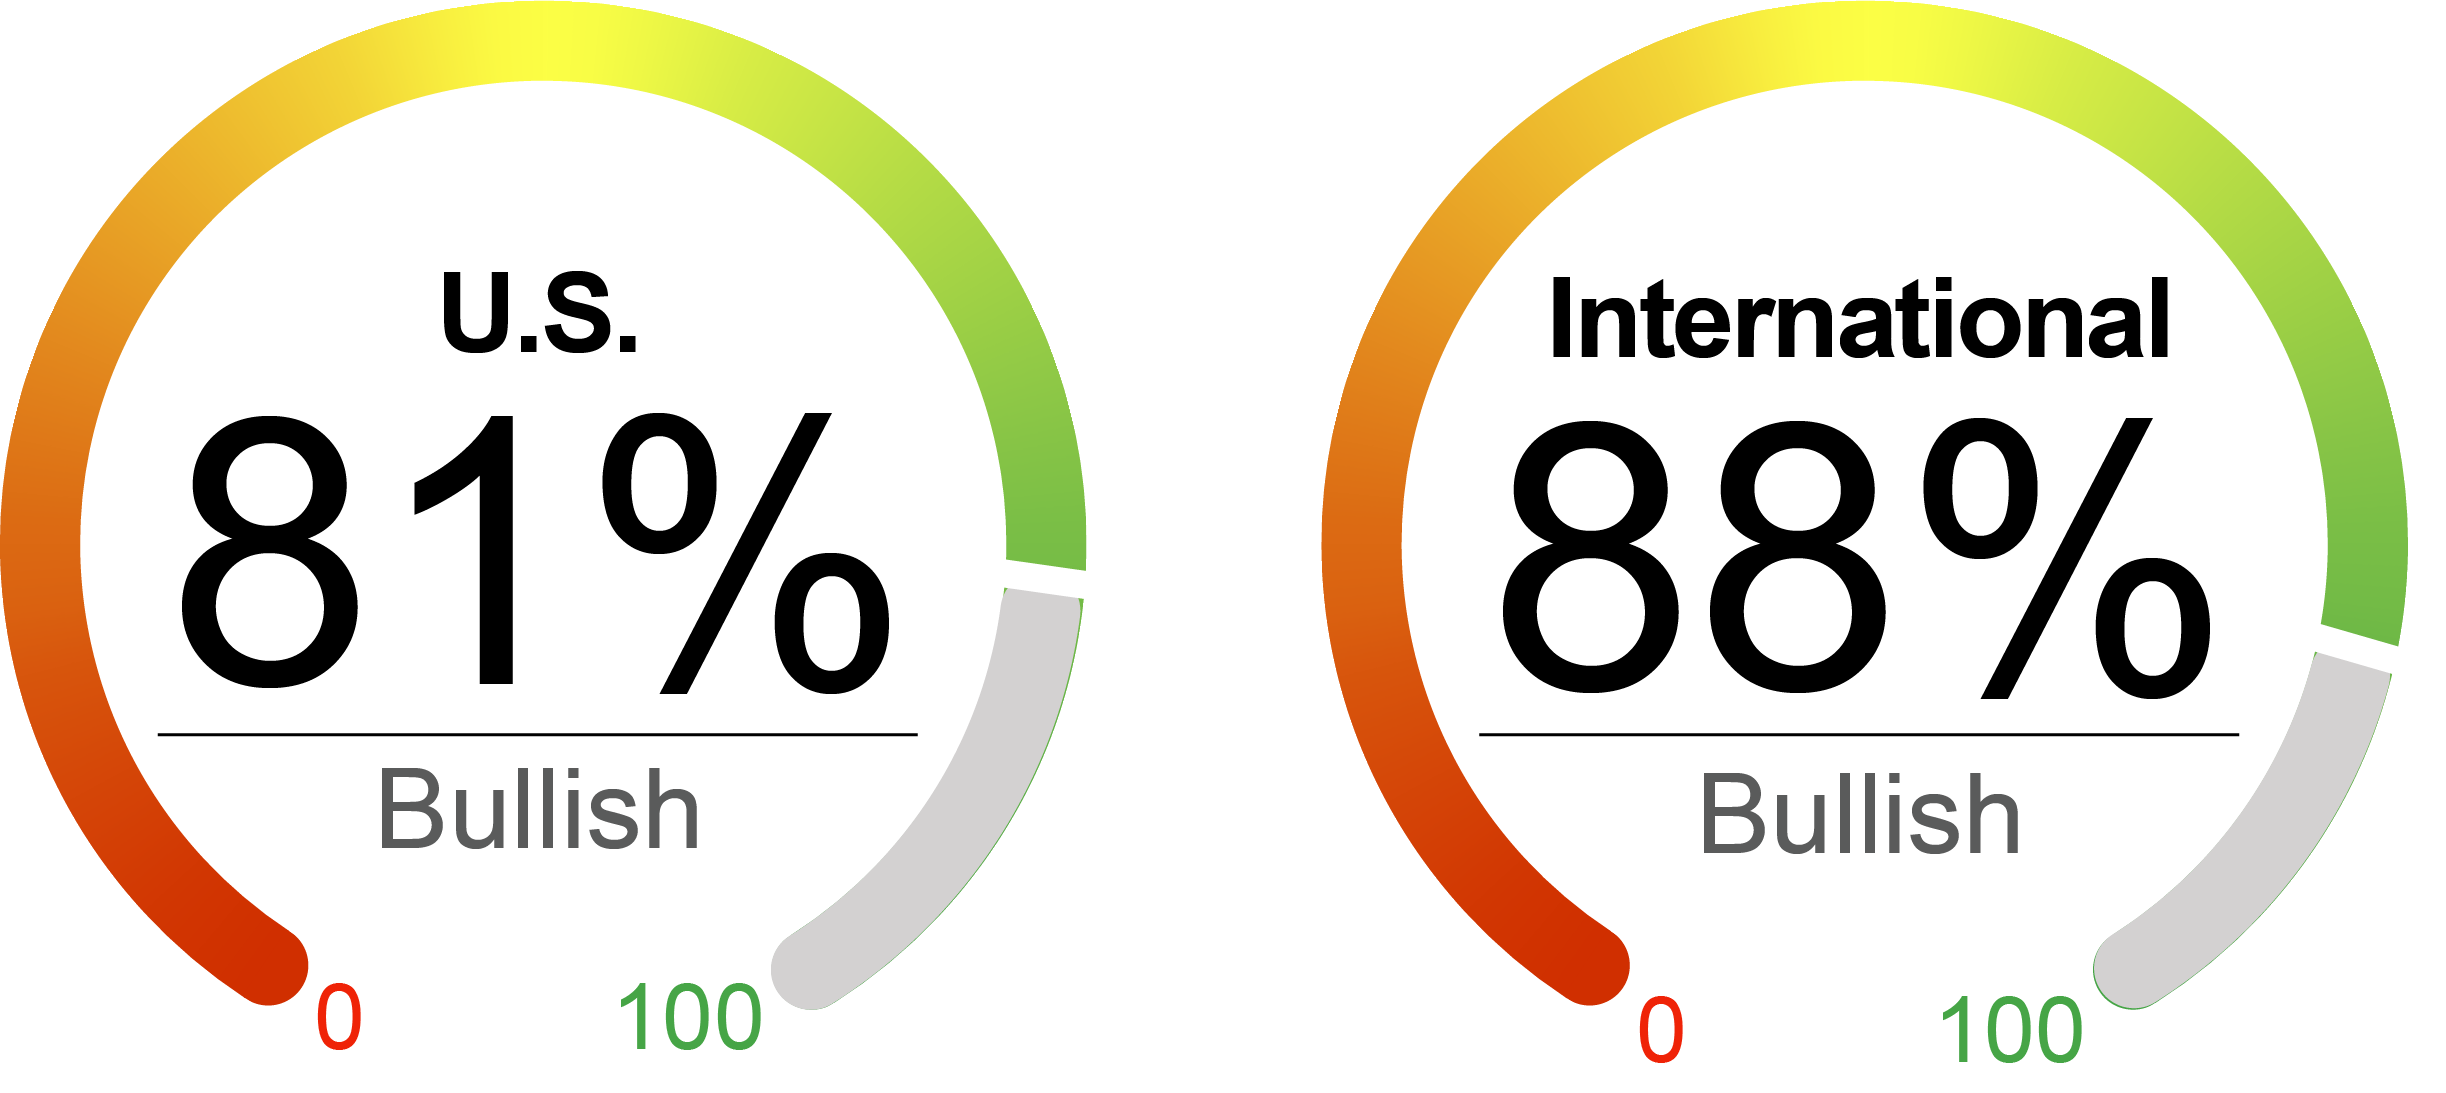
Market technicals remained positive as many over-crowded trades have been partially unwound. Also, valuations improved marginally with both trailing and forward P/E modestly decreased. We have slightly increased our investment level to 81% in U.S. equities as the market pulled back in the middle of the month. Valuations internationally remain relatively more attractive are we are 88% invested in our flagship international strategy.
U.S. Equities (S&P 500 Index) | 12.4%
International Equities (MSCI ACWI ex-U.S.) | 9.8%
U.S. Bonds (Barclays U.S. Aggregate Bond Index) | -2.3%
Global Bonds (JP Morgan Global Aggregate Bond Index) | -2.5%
The NorthCoast Navigator is a market barometer displaying NorthCoast's current U.S. equity outlook. This aggregate metric is determined by multiple data points across four broad market-moving dimensions: Technical, Sentiment, Macroeconomic, and Valuation. The daily result determines equity exposure in our tactical strategies.
As of 5/31/2021. Data provided by Bloomberg, NorthCoast Asset Management.
*Source: Bloomberg, WSJ, NorthCoast Asset Management.
|
Negative Indicator |
Neutral Indicator |
Positive Indicator |
Positive Indicator |
|
Valuation With market ending modestly higher this month, valuations for equity improved marginally, but still appear overvalued. P/E ratios decreased to 29.8 at the end of May from 29.9 at the end of March. Forward P/E ratio also decreased slightly. Inflation adjusted valuation metrics continued to be negative with inflation rising. |
Sentiment Consumer sentiment dropped in May with inflation fears as the University of Michigan consumer sentiment index came in at 82.9, down from 88.3 in April. Confidence is under pressure with stimulus starting to fade and gasoline prices moving higher, but wealth remains healthy with massive saving, decreasing debt and accelerating housing price. PMI index fell slightly, but remains elevated above 60. |
Technical Technical indicators remain positive but look stretched. At the end of April, the S&P 500 was 12% above its 200-day moving average, 5% above the 100-day average and 2% above the 50-day average. Volatility spiked with VIX index reaching to 27.6 in the second week of the month, but came down and settled at 16.8, compared with 18.6 at the end of last month. |
Macroeconomic Labor market continued to improve with weekly initial jobless claims fell for four consecutive weeks and reached closest to pre-pandemic level, though the payroll employment was weaker than expected. Industrial production rose 0.7% following a 2.4% gain in March. U.S. manufacturing seems to have weathered the global semiconductor shortage reasonably well and the near-term outlook remains favorable. Inflation remains risk with the core PCE price index increased 3.1% YOY. |
Important Disclosures
The information contained herein has been prepared by NorthCoast Asset Management LLC (“NorthCoast”) on the basis of publicly available information, internally developed data and other third party sources believed to be reliable. NorthCoast has not sought to independently verify information obtained from public and third party sources and makes no representations or warranties as to accuracy, completeness or reliability of such information. All opinions and views constitute judgments as of the date of writing without regard to the date on which the reader may receive or access the information, and are subject to change at any time without notice and with no obligation to update. This material is for informational and illustrative purposes only and is intended solely for the information of those to whom it is distributed by NorthCoast. No part of this material may be reproduced or retransmitted in any manner without the prior written permission of NorthCoast. NorthCoast does not represent, warrant or guarantee that this information is suitable for any investment purpose and it should not be used as a basis for investment decisions. © 2021 NorthCoast Asset Management LLC.
PAST PERFORMANCE DOES NOT GUARANTEE OR INDICATE FUTURE RESULTS.
This material should not be viewed as a current or past recommendation or a solicitation of an offer to buy or sell any securities or investment products or to adopt any investment strategy. The reader should not assume that any investments in companies, securities, sectors, strategies and/or markets identified or described herein were or will be profitable and no representation is made that any investor will or is likely to achieve results comparable to those shown or will make any profit or will be able to avoid incurring substantial losses. Performance differences for certain investors may occur due to various factors, including timing of investment. Investment return will fluctuate and may be volatile, especially over short time horizons.
INVESTING ENTAILS RISKS, INCLUDING POSSIBLE LOSS OF SOME OR ALL OF AN INVESTMENT.
The investment views and market opinions/analyses expressed herein may not reflect those of NorthCoast as a whole and different views may be expressed based on different investment styles, objectives, views or philosophies. To the extent that these materials contain statements about the future, such statements are forward looking and subject to a number of risks and uncertainties.