Equities
73%
| Date | Update |
|---|---|
| April 17, 2018 |
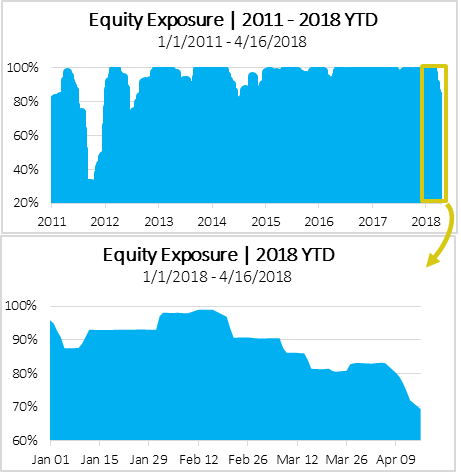
CAN SLIM® International holds a 30%+ cash position Since its inception in 2011, our international investment strategy has maintained a relatively bullish posture. Over the 7+ years, the strategy has averaged an 87% equity exposure. If you remove 2011 from the statistics, when international markets were rattled by global events like the downgrading of U.S. government debt and the Greek financial crisis, the strategy has averaged over 90% exposure to equities. For the 1st time since July 2012, the strategy has decreased its equity exposure below 70%, holding a little over 30% in cash reserves as a defensive tactic. The current exposure is determined by our Global Tactical Asset Allocation (GTAA) model – an aggregate metric determined by multiple data points across four broad market-moving dimensions: Technical, Sentiment, Macroeconomic, and Valuation. The daily result determines equity exposure in our international strategies.
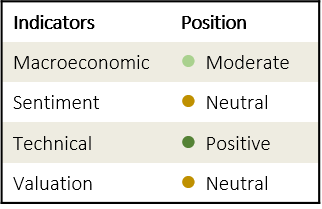
A cautious outlook for international equities in the near-term Technical indicators fluctuated during the volatile quarter with momentum signals lower as the ACWI ex-U.S. index almost broke below the 200-day moving average. Other technical signals such as short-term market reversal and our fear indicator dropped as well. Sentiment from both consumers and producers turned cautious throughout the quarter. PMI indicators in China and Eurozone, Economic Surprise Index in both Eurozone and G10 countries, ZEW Germany Expectation of Economic Growth Index and France Business Confidence Composite Indicator all declined in the quarter. Macroeconomic news was also less than optimistic. Industrial production showed weakness in the first quarter in the Eurozone while Japan's industrial production plunged 6.6% in January. In addition, global leading economic indicators showed evidence of a possible slowdown. The latest tariff tension between the U.S. and China along with investors’ fear of a trade war pose downside risk to the global equity outlook. Although we generally believe the odds of a trade war remain low, the potential economic impacts of such a war could be significant.
The plan moving forward As always, things change and though we currently hold an above-average hedge, we will allow data & discipline to drive our decision going forward. We will decrease market exposure when the risk outweighs the future return potential and strategically increase exposure when the data warrants. We will continue to monitor the market daily and adjust accordingly.
|
| October 24, 2017 |
The CAN SLIM® International strategy continued its positive run throughout the third quarter as international equities pushed higher across the board. For the quarter, the strategy was up +4.7% net of fees while the benchmark index, All Country World Index ex-U.S. (ACWI ex-U.S.), was up +6.2%. Strategy attribution analysis helps to break down CAN SLIM International’s performance relative to the ACWI ex-U.S. First, we consider the allocation of cash held in the strategy during the quarter. The average cash position was 3.7%, which had a negative impact on our strategy’s relative performance of -0.2%, due to the continued uptrend of international equities. While cash helps protect assets in down-trending markets, it is a hindrance when equities rise. This is a strategic trade-off when utilizing a cash scaling technique. You can read more about the way we scale to cash here (our case study using domestic equities). Second, we compare the strategy’s sector allocation versus the index. The most notable differences in allocation were overweight the Healthcare Sector and underweight Consumer Staples and Industrials. Overall, our sector allocation decisions had a +0.6% effect on relative performance thanks in large part to a very successful quarter for the international healthcare sector. Finally, we inspect the impact of stock selection within the sectors. During the quarter, stock selection contribution was positive in Industrials, Consumer Staples and Consumer Discretionary, while negative in Financials, Information Tech and Health Care. The combined contribution was -0.6% to relative performance. |
| October 17, 2017 |
BASF (Ticker: BASFY) issued a 300% distribution that CAN SLIM® International and Global investors will be seeing in their accounts today. In addition to the distribution, clients invested in these strategies received 3 additional shares of BASFY for every 1 share they held (4:1 stock split), however there will be no significant change to the account’s market value. Investors will simply be holding more shares at a lower price with the same total dollar value. Any change in this holding will be due to market fluctuations, not the corporate action. Please click here for more details on the corporate action. If you have any further questions, please contact your advisor at NorthCoast. |
| March 7, 2017 |
We wanted to inform you about a tax item regarding our CAN SLIM® International strategy. In 2016, the strategy was invested in the position, Popular Inc (Ticker: BPOP), which was liquidated in August. The holding paid out quarterly dividends on three separate occasions in 2016;
These dividends were classified as income and the income is subject to tax withholding thus generating a tax form provided by your account custodian (Fidelity, Schwab, etc) titled Form 480.6C. Please check your account online or mail (if you receive tax forms via USPS). We understand the burden of tax season and we want to do everything we can to assist. Being a tax sensitive situation, we recommend you consult your tax advisor but if you need additional help or would like to speak with us, please contact us at your convenience. We’re happy to help. You can call us at (800) 274-5448 or email privateclients@northcoastam.com. |
| April 28, 2016 |
ENERSIS CHILE S.A. completed the spin-off by Enersis Américas S.A. (NYSE: ENIA) of Enersis Chile (the "Spin-off"). The spin-off was first announced on April 4. The share price of ENIA was split in half and each account holder receives an equal amount of the spun-off company, ENIC, to compensate for the split. Once there is final settlement of the necessary shares, our portfolio management team will analyze the future return potential of both ENIA and ENIC and decide how to best proceed. For more information on the spin-off, you can click the link here. |
| January 4, 2016 |
In CAN SLIM® International, Fiat-Chrysler's (FCAU) spin-off of Ferrari, first announced more than a year ago, is now complete. On Dec. 31, FCAU shareholders received one Ferrari common share for every 10 Fiat Chrysler common shares held. The shares will take a few days to settle in client accounts. Once they do, our portfolio management team will analyze the future return potential of the new Ferrari shares and decide how to best proceed. For more information on the spin-off, you can click the link here. |
| December 16, 2015 |
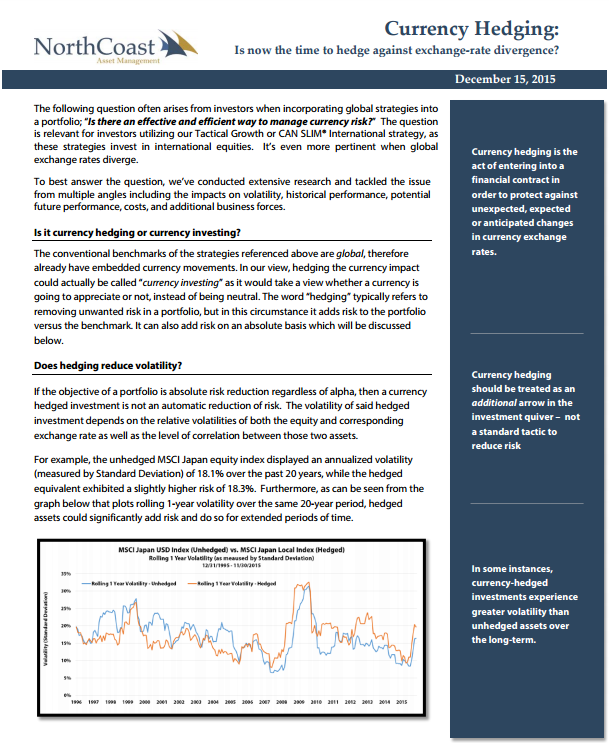
The following question often arises from investors when incorporating global strategies into a portfolio; “Is there an effective and efficient way to manage currency risk?” The question is relevant for investors utilizing our Tactical Growth or CAN SLIM® International strategy, as these strategies invest in international equities. It’s even more pertinent when global exchange rates diverge. To best answer the question, we’ve conducted extensive research and tackled the issue from multiple angles including the impacts on volatility, historical performance, potential future performance, costs, and additional business forces. Click the image link below for the full report.
|
| November 2, 2015 |
International equities rallied in October and produced a monthly gain for the 1st time in over six months. CAN SLIM® International maintained a bullish posture throughout the month as international markets continue to benefit from expanded stimulus packages across the globe. |
| September 1, 2015 |
International equities declined for a fourth consecutive month as global markets were shaken by growth concerns in China. CAN SLIM® International with approx. 6% exposure in Chinese equities, felt the negative effects of the broad market hit. |
| July 1, 2015 |
CAN SLIM® International dipped into negative territory as international equities declined almost 3% in June. A high exposure to Canada dampened performance in the strategy as Canadian stocks have not kept pace with the majority of international markets. The strategy maintains a high equity exposure as international outlook remains bullish. |
| June 2, 2015 |
International stocks experienced a minor setback in May amid an otherwise stellar performance in 2015. While still positive for the year, CAN SLIM® International lags its global benchmark. The portfolio’s current 14% exposure to Canadian stocks dampened performance as Canadian stocks (EWC) sank -6% in May. |
| May 4, 2015 |
International exposure remained at a high level as global equities continue to power through 2015. Central bank stimulus packages, possible inflation in the Eurozone, and rallying equity markets in Australia and Hong Kong propelled equities higher. |
| April 6, 2015 |
International exposure remains high as global markets show continued strength in 2015. Stimulus packages across the globe lifted international stocks, with some indices experiencing double-digit gains. CAN SLIM® International added to its break-out February with a positive March. |
| March 3, 2015 |
International exposure remains high as global markets continue to accelerate in 2015. The strategy broke out in February with strong performance, particularly as financial stocks rebounded. |
| February 26, 2015 |
CAN SLIM® International locked in profits on DOX and TEL by reducing exposure in the positions as they have provided double-digit returns this year. The strategy aims to add other position with attractive entry points across the global landscape. |
| February 2, 2015 |
International stocks ended January relatively flat but exposure to financial equities in CAN SLIM® International led to a bumpy start to the year. As the global economy searches for its identity in 2015, we expect holdings in the strategy to carry more volatility but the prospects still remain attractive. |
| January 6, 2015 |
CAN SLIM® International felt the effects of an underperforming global marketplace. Across international markets including Europe and China, international equities ended negatively, but with an average 15% cash level throughout the year and profitable stock selection, CAN SLIM® International ended slightly below even. |
| December 2, 2014 |
CAN SLIM® International steadily increased its equity exposure throughout November as global markets provided an opportunity for attractive entry. Performance doubled the ACWI ex-U.S benchmark for the month as stock selection boosted the portfolio. |
| November 5, 2014 |
Maintaining its 80% equity exposure, CAN SLIM® International was able to bounce back after the early month losses, but international equities continue to trail U.S. counterparts as currency and macroeconomic factors hamper growth. |
| October 1, 2014 |
At approx. 80% invested throughout the month, CAN SLIM® International experienced a modest pullback in comparison to the almost -5% in international equities (ACWI ex-U.S.). |