Equities
87%
| Date | Update |
|---|---|
| September 20, 2019 |
What is your outlook in Emerging Markets? Our outlook for Emerging Markets has decreased slightly compared with the end of last quarter, but we are still on the positive side with strong macroeconomic and sentiment signals. Areas of concern include China’s August industrial production figures, fixed asset investment, exports, and retail trade, which all weakened. The recent spike in oil prices might also have adverse consequences on China's economy. Higher fuel prices might dent already-weakened consumers’ discretionary spending and add input costs in an already-weakened demand environment.
|
| September 20, 2019 |
How are you expecting U.S. equities to finish out the year? Our global tactical asset allocation model still indicates a cautiously bullish outlook for the U.S stock market in the near-term. However, the long-term signals have decreased recently. The short-term targeted equity level at the moment is around 90% while the long-term signals indicates a target level of about 70%. An area of concern is that the probability of a recession has slightly grown. We monitor a number of data points to help determine the probability of a recession. For example the yield curve, which went into a deeper inversion, contributed to the elevated odds. However, we don’t expect a recession to occur in the near future since the macroeconomic data points we monitor are still relatively upbeat. Industrial production rose 0.6% in August, its third increase in the last four months. The total capacity utilization also rose 0.4%. Some macroeconomic and sentiment figures are less optimistic including the labor market and PMI data. The labor market moderated further in August. Payrolls increased by 130,000 jobs, bringing average growth to 158,000 per month this year, far below the 2018 pace, confirming suspicions that the pace of hiring has cooled. Also, U.S. PMI data has been decreasing every month since March this year. In August, the PMI data indicated that the U.S. manufacturing sector is contracting for the first time since the end of the energy rout. The ISM manufacturing index fell from 51.2 in July to 49.1 in August, the lowest reading since January 2016 and below the neutral threshold level of 50.
|
| September 20, 2019 |
U.S. Mid-Cap (IJH) remains a significant position. Is there anything that stands out about IJH in comparison to its large-cap counterpart (IVV) right now? Our model indicated higher sentiment signals for IJH compared with IVV. Implied volatility and short interest are reading more negatively for large multinational companies at the moment. Smaller-cap companies, as a whole, are less dependent on international markets for growth, therefore they are likely to be less sensitive to lingering risk of the trade wars.
|
| September 20, 2019 |
You added to your Pacific Region Ex-Japan (EPP) position in Q2 and have maintained it for Q3. What appeals to you about EPP going forward? Our model indicated a relatively strong score for EPP with three of the sub-group of signals (valuation, macro and sentiment) all in positive territory (technical indicators make up the fourth sub-group). Although Australia’s GDP growth hit a decade low in Q2, the almost 30-year uninterrupted growth track record isn't under material threat. Exports were particularly strong for the country. Both the buoyant demand and high prices for hard commodities along with the weak Australian dollar were key drivers to an export surplus of $5.9 billion in the June quarter the first surplus since mid-1975.
|
| July 1, 2019 |
"NorthCoast Asset Management ETF portfolios again caught the large-cap rally in Q2 from a commitment to U.S. stocks. The firm made minor adjustments to its portfolios, but maintained large-cap and midcap ETFs among its top holdings with a cautiously bullish outlook. NorthCoast remained upbeat on bets in Pacific region and emerging market ETFs....." Read the full article by clicking the link below. Investing For Retirement: Large-Cap Rally Fuels Gains for NorthCoast ETF Portfolios |
| March 29, 2019 |
"Betting on U.S. equities paid off for NorthCoast Asset Management in Q1. After fading late in 2018, top holdings of the firm's ETF retirement portfolios have come roaring out of the blocks this year. NorthCoast took a slightly more conservative allocation as the quarter came to a close, but still has a favorable outlook for ETFs focused in select international markets. Here are some highlights from Q1...." Read the full article by clicking the link below. Investing For Retirement: NorthCoast Asset Management Captures Rally In Q1 |
| January 1, 2019 |
What is your outlook for the U.S. equity market for 2019? Our global tactical asset allocation (GTAA) model still signals a relatively bullish outlook for the U.S. equities. Strong readings in sentiment and valuation indicators outweigh weaker technicals and recent price pullbacks. In 2018, the U.S. economy enjoyed a banner year with real GDP annual growth rate on track to increase by close to 3%, which is the strongest gain of the nearly decade-long expansion. We believe the deficit-financed tax cuts and government spending increases will continue to help the economy grow much of next year. We also expect the labor market to continue to grow and unemployment to stay low by historical standards. Despite these positive signals, we do recognize some possibilities of weakness moving forward. The stimulus effect might fade and put downward pressure on the market in the longer term and diminishing labor supply might result in gradually decreasing prices. The ceasefire between the U.S. and China may indicate that the worst of the escalations are behind us. However, the trade tension remains and might contribute to equity volatility. We do expect some market volatility to continue through 2019 despite our model indicating that the odds of a near-term recession remain relatively low. |
| December 31, 2019 |
Earlier this month, our ETF-managed portfolios were highlighted in the Investor's Business Daily. "NorthCoast Asset Management recalibrated the holdings of its ETF portfolios in Q4 as market turbulence kicked up. The firm added short-term Treasury ETFs and cut back on its exposure to Europe to weather the storm. It also saw sell-offs as buying opportunities. Here are highlights for the portfolios during the quarter..." Read the full article by clicking the link below. Investing For Retirement: NorthCoast Asset Management Shifted To Short-Term Treasury ETFs In Q4 |
| December 30, 2018 |
What do you make of the recent volatility in the market and how has it, or hasn’t it, impacted your outlook and investment decisions for the portfolios? The recent volatility has not significantly impacted our outlook as our model has been indicating that the fundamentals of the U.S. economy are still relatively sound. As a result, the market volatility has served as an opportunity to tactically add some U.S. equity exposure at lower prices. We see this volatility as a reaction to uncertainty. However, the uncertainty has not materialized into impactful changes to fundamentals.
|
| December 29, 2018 |
Are there any developments that have changed your outlook on Canada? Our GTAA model indicated a higher score for Canada (EWC) partially due to an increase in sentiment signals. The Canadian Purchasing Managers’ Index recovered in October rising from 50.4 to 61.8, where 50 is the threshold between expansion and contraction. Purchasing mangers’ hiring intentions also rose moderately and inventories posted a significant jump. The uncertainty surrounding trade relations with the U.S. caused some businesses to pull back on investment. However, we believe that the tentative agreement on a new North American free-trade pact will help to restore some confidence and possibly release some pent-up spending.
|
| December 28, 2018 |
What was been the role of real estate in the portfolios and what is the outlook for this asset class? Our exposure to real estate in the portfolios in 2018 has been iShares U.S. Real Estate ETF (IYR). With interest rates and bond yields still being relatively low, IYR (a securitized portfolio of properties) offers the income potential of real estate combined with the liquidity of stock. The yield of 3.8% has produced a relatively solid source of income for the portfolios. Moving into 2019, we are closely monitoring the trend of rising interest rates because it can put pressure on the rate-sensitive prices of REITs.
|
| September 30, 2018 |
What developments regarding Canada (EWC) led to an increased exposure? Sentiment in Canada improved in Q3 with the Canada Manufacturing PMI reaching 57.1 in June, the highest level in five years. Both July and August sentiment data remained robust despite the uncertainty of the trade pact between the U.S. and Canada. The consistently solid readings in PMI data point to modest growth in the Canadian manufacturing sector throughout the rest of 2018. Economic signals have also been strong for Canada led by industrial capacity utilization, which improved significantly in the third quarter. This strength provides an encouraging picture for economic growth in the latter half of 2018, and the economic surprise index also increased steadily in recent months. |
| September 30, 2018 |
What is the outlook for the Eurozone (EZU) going forward? Outlook for the Eurozone (EZU) is less optimistic compared with our view of the U.S. (IVV) and some other international equity markets. Four indicators used to determine asset allocation are all in negative territory for the Eurozone: technical, sentiment, macroeconomic and valuation. The annualized Eurozone GDP growth rate for the second quarter was revised down to 2.1%, which supports that the growth rate may have peaked at the end of last year and is on pace to slow down in 2018. Eurozone industrial production also declined by 0.8% month-over-month in July, lower than the consensus analysts’ forecast. The Eurozone’s sentiment indicator dropped slightly in recent months. The main drag came from deteriorating consumer confidence amid concerns of easing demand and unresolved trade talks with the U.S. Political uncertainty has also created unease in the union. Valuation and technical signals for the E.U. are weak according to our global tactical asset allocation (GTAA) model.
|
| September 30, 2018 |
What is appealing about the Pacific region developed market, excluding Japan (EPP)? Near-term outlook for the Pacific region developed market, excluding Japan (EPP), is more upbeat with macro and sentiment signals being the major contributors. Recent Australian economic data have been encouraging as the GDP annual growth rate hit 3.4% during the second quarter. The country’s labor market has been tightening with the unemployment rate continuing its downward trend and the labor participation rate picking up. Downside risks remain in the region with escalating trade tensions between the U.S. and China. Hong Kong’s PMI data remained low and indicated contraction in private sector activity for five consecutive months. This contraction is largely due to shrinking Chinese demand for Hong Kong’s products and services.
|
| September 30, 2018 |
U.S. equity positions continued to move higher (IVV, IJR, IJH). What were the most prominent factors that led to these gains? Despite some unease in the U.S. stock market, it has performed significantly better than other major international equity markets. The divergence this year has been largest between U.S. and emerging market equities, which have lost roughly 10% YTD due to trade tensions and a rising U.S. dollar. U.S. small-cap stocks (IJR) have outperformed their large (IVV) and mid-cap (IJH) peers this year and our outlook remains more bullish for small-caps relative to these peers. Earnings have been one of the main drivers of the impressive U.S. equity market performance. Our outlook remains cautiously bullish with relatively strong technical, sentiment and macroeconomic signals. New economic data has also been solid recently. Payroll growth, initial jobless claims, retail sales, industrial production and consumer and credit sentiment have all been moving in positive directions. |
| June 29, 2018 |
With a dissapointing first half in emerging market equities (IEMG), what is the outlook for the second half of the year? Our asset allocation model indicated a less bullish outlook for emerging market equities with valuation, macro and technical signals in negative territory. Macroeconomic data in the emerging market countries have failed to beat forecasts, as evidenced by a rapid decrease of the economic surprise index. China’s May economic activity data disappointed as fixed asset investment growth reached its lowest rate on record. The important trade relationship between the U.S. and China has been fraught with friction for months. Tensions have been escalating in recent weeks as proposed tariff deadlines approach and both sides showing a reluctance to concede. The uncertainty and trade tensions have, in the short-term, negatively impacted financial markets. Souring investor sentiment from the heightened uncertainty is prompting more cautious economic behavior at a particularly inconvenient time. |
| June 29, 2018 |
What is your outlook currently for the Eurozone (EZU) particularly in regards to talks of U.S. trade protectionism? First quarter final GDP numbers for the Eurozone confirmed that the region’s growth slowed at the start of 2018. A broad-based slowdown in investment was the main factor behind the easing of the Eurozone’s first quarter GDP growth rate. Eurozone industrial output, which fell by 0.9% month-over-month in April, and a weak energy sector were additional factors. Our asset allocation model indicates a neutral-to-slightly negative outlook for the region with valuation, sentiment and technical signals all in negative territory. In the near term, souring sentiment due to trade uncertainties will likely keep investment subdued and impact manufacturing in major Eurozone countries. With the exception of May, the IFO sentiment index has decreased each month in 2018. Germany’s ZEW Indicator of Economic Sentiment has plunged by a cumulative 36.5 points over the past six months. |
| June 29, 2018 |
U.S. small-cap equities (IJR) have had a pretty strong run this quarter, to what do you attribute this upswing and how do you like it on a protective basis? Small cap companies have more to gain from deep corporate tax cuts introduced by the Trump administration this year as they have often paid higher effective tax rates than their larger rivals in the past. Also, since small cap companies are generally less internationally oriented, they are generally less vulnerable to the impacts of potentially escalating trade tensions between the United States and other countries. Our outlook for IJR is relatively bullish as it scores the highest compared with U.S. large-cap equities (IVV), U.S. mid-cap equities (IJH) and other major international equity ETFs. |
| June 29, 2018 |
What appeals to you about U.S. large-cap equities (IVV) heading into the second-half of the year?
The U.S. economy is still fundamentally strong with job growth accelerating since September 2017 and unemployment rates reaching new lows. Wage growth, as measured by the employment cost index for private wages, has also been rising which is generally consistent with the tightening labor market and a narrowing in the unemployment rate gap. Manufacturing has become one of the stronger components of the U.S. economy with almost all of the regional economies picking up steam in recent months. As a result of this positive economic data our market timing model shows a slightly more bullish outlook for the U.S. equity market compared with the first quarter’s outlook. Sentiment remains optimistic as the U.S. consumer is feeling more upbeat about its current financial situation. However, the Trump administration’s formal announcement of additional tariffs on Chinese imports has raised concerns about trade tension between the two largest economies in the world. These tariffs could increase uncertainty and weigh heavily on financial market conditions and the collective sentiment. |
| January 19, 2018 |
Tactical Growth took advantage of a very positive 2017 for global equities with a total return of +19.4%. A bullish average equity exposure of 95% over the course of the year and advantageous ETF selection contributed to this positive growth and the outperformance of the competitor average in the tactical space, while keeping relatively in line with the aggressive benchmark, the MSCI All-Country World Index (ACWI). An average 5% allocation to cash and fixed income throughout 2017 did detract slightly from performance relative to a fully-invested equity index. However, overweight allocations to Eurozone and Western Europe ETFs and maintaining exposure to emerging markets contributed greatly to the positive ETF selection attribution to performance. Read the entire year-end review for Tactical Growth here.
|
| January 3, 2018 |
What drove the additional allocation to U.S. equities in the growth portfolios and how do you like the asset class heading into 2018? We increased exposure to IVV (iShares Core S&P 500 ETF) as our model indicated a relatively bullish outlook for the U.S. equity market with stronger sentiment and macroeconomic signals. Leading sentiment indicators climbed or stayed at high levels in 2017 and producer sentiment recently strengthened. The ISM manufacturing index remained solid the last three months driven by the belief that the U.S. manufacturing conditions are improving as the global economy has strengthened and the U.S. dollar has depreciated. The homebuilder sentiment index also climbed steadily this quarter hitting 74 in December, the highest level since July 1999, indicating that the housing market is well positioned for growth in the coming months. Macroeconomic data became more bullish with the labor market continuing to tighten. Weekly initial jobless claims fell four consecutive weeks in late November and early December while industrial production posted steady gains for the last three months of the year. We remain cautiously optimistic heading into 2018, seeing both strong growth indications as well as some cautious signals. The steady pace of economic growth is likely to be among the most significant drivers for the domestic equity market going forward. With the tightening labor market, wage growth, and surging stock and housing prices, consumers were one of the strongest sources of growth and will be looked upon to continue driving the economy moving forward. However, with the winding down of quantitative easing and possibly higher interest rates, risks remain for U.S. equity prices. We monitor these risks daily, especially as stock market valuations remain stretched. We have a similar rational for mid-cap equities in IJH (iShares Core S&P Mid-Cap ETF) as we have for IVV, being cautiously optimistic about the U.S. equity market throughout 2017 and moving into 2018. What factors led to the trimming of Canadian equities? We trimmed EWC (iShares MSCI Canada ETF) in October as macroeconomic data in Canada turned downward. GDP growth rapidly decelerated in the third quarter, slowing from an annualized rate of 4.3% to 1.7% as diminishing demand for exports offset an increase in domestic demand. The housing market in Canada was also hurt by the tightening of monetary policy and higher interest rates. What appealed to you about emerging markets that has led to an increased allocation to the position? Emerging market equities were among 2017’s top gaining asset classes. Our model indicated a high score for IEMG (iShares Core MSCI Emerging Markets ETF) led by its macro and sentiment components, which are among the highest compared to other international equity ETFs. Manufacturers and exporters in many Asian markets received a boost recently, benefiting from the upswing in the global tech cycle. As a result, manufacturing sentiment improved. Macroeconomic signals also increased in recent months, particularly leading economic indicators and retail sales. What themes will you be focusing on in 2018 when you consider your Eurozone positions? Our outlook for EZU (iShares MSCI Eurozone ETF) remains optimistic. The relatively strong economic growth was among the major drivers of the impressive performance of EZU for the year. The bullish sentiment signals such as the PMI signals also suggested that Eurozone industrial sectors are firing on all cylinders. The highly accommodative monetary policy from the European Central Bank (ECB) certainly contributed to the market rally this year. Going forward, we will continue to focus on the outlook of Eurozone economic fundamentals, the sentiment of the market and ECB’s monetary policy. Unlike the Federal Reserve, we expect the ECB to keep a more accommodative stance in the near future if the Eurozone inflation continues to be below-target.
For more commentary from CIO Patrick Jamin on the final quarter of 2017, Click Here |
| October 4, 2017 |
What factors led to the addition of international treasury bonds (IGOV) to the ETF portfolios? Three out of four sub-groups of market-moving indicators (macroeconomic, technical and sentiment) were in positive territory. We had been eyeing IGOV for some time and found a good entry point in the third quarter as its liquidity improved. What development contributed to the increased allocation to Canadian equities (EWC)? Canada’s economic growth has been robust this year. GDP growth accelerated in the second quarter at an annualized rate of 4.5%, besting the first quarter's already-impressive 3.7% pace. Robust consumer spending and a sharp uptick in exports made the strong second quarter gain possible. The trade was also triggered by relatively strong sentiment signals in Canada, as well as the PMI extending its impressive run as August turned in the 15 straight above-50 reading. Compared with other region and country ETFs we monitor, the valuation signal for EWC was among the highest. Eurozone equities (EZU) also posted strong returns during the quarter and for the year. What can the strong performance be attributed to? The relatively strong economic growth was among the major drivers of EZU’s strong performance. The Eurozone recovery has become entrenched and broad-based, with net exports as the largest contributor to the expansion this year. The economic growth rate was slightly ahead of the U.S. and well ahead of the U.K. as Eurozone’s real GDP growth picked up to 2.3% in the second quarter.In addition, job creation was very robust and the sentiment indicators, such as PMI, continued to be strong. The Eurozone Manufacturing PMI increased to 58.2 in September from 57.4 in August, pointing to the biggest expansion in manufacturing activity since February of 2011. What led to the trimming of United Kingdom equities (EWU)? Our model showed relatively weaker valuation, technical and sentiment indicators for EWU. UK’s economic leading indicator was not as optimistic as the Eurozone or other regions and countries. Economists forecasted U.K.’s GDP projection for the year to be 1.6%, down from 1.8% last year. The industrial sector, which continued to expand but failed to recoup losses from earlier in the year, was another negative signal. This confirms our view that factory growth will fail to offset 2017’s consumer-led slowdown in the service sector despite the pound’s sharp depreciation. We are also cautious about the long-term outlook of UK’s economy and equity market. The fallout from departing the EU may have ripple effects on the economy and too many questions still remain before a clear picture of the post-Brexit U.K. emerges. How do you like the prospects of large-cap U.S. equities (IVV) for the upcoming quarter? Our model is cautiously bullish on U.S. large-cap equities (IVV). Although the valuation and sentiment signals remained relatively weak compared with other international equity markets, the fundamentals of the U.S. economy are still strong. The macroeconomic data that weakened, such as industrial production and initial jobless claims, was partially due to hurricanes Harvey and Irma. We expect the Texas energy and Florida tourism industries to be operating at close to normal levels by the end of the September. The expected recovery of Puerto Rico and surrounding areas from Hurricane Maria is yet to be determined. Rebuilding from the storms will boost GDP beginning in the fourth quarter and into 2018, and the longer-term economic impact of the storms should be negligible. Although the labor market continued to show decent growth in recent months, consumers’ ability to lead economic expansion is likely to come to an end in the face of weakening salary income growth. Finally, the future path of short-term rates could add some possible volatility to the financial markets. To view the rest of Patrick's comments with IBD, click here. |
| January 27, 2017 |
Tactical Growth ended 2016 with a total return of 7.7%, outperforming the average competitor in the tactical space and also keeping in line with the aggressive MSCI All-Country World Index (ACWI). While the defensive positioning away from equities in general detracted from performance, for the most part our ETF selection benefited the portfolio in both equity ETFs (overweight to U.S. small and mid-cap equities and Canadian equity market, underweights to UK and Japanese equities), and fixed income ETFs (overweight in corporate, emerging-market and high-yield bonds)... Read the entire year-end review for Tactical Growth here.
|
| January 19, 2017 |
BlackRock announced today the Board of Trustees of iShares Trust has authorized a share split for iShares Core S&P Small-Cap ETF (IJR). The Board has approved a 2-for-1 split for this fund for shareholders of record as of the close of business on January 13, 2017, payable after the close of trading on January 18, 2017. The 2-for-1 split will lower the share price and increase the number of outstanding shares. The total value of shares outstanding in your portfolio is not affected by the split. You can read more information on the split by clicking here. |
| August 3, 2016 |
What is attractive about CLY (10+ Year Credit) right now?The expectation of fewer future rate hikes makes U.S fixed income with relatively longer duration more attractive. Three out of four categories of our indicators are positive for CLY: valuation, technical and sentiment. The relatively high yield of CLY (4%) can be helpful in boosting the income for the strategy. Given the current market conditions, our cash scaling model indicates a modestly bullish outlook on U.S equity market with a targeted investment level at around 85%. Instead of holding the remaining assets in cash equivalents, effectively yielding 0%, the strategy invests in CLY. However, we closely monitor the duration risk of the position. What do you attribute the recent strength of IVV (S&P 500 Index) to with the S&P 500 setting new highs? And what is your sentiment going forward on the position?We believe the fundamentals of U.S. economy are still sound. The better than expected payroll employment in June indicated that the labor market has regained some momentum after the weaker data in May. In fact, the job market has enjoyed the longest string of consecutive monthly job gains in the nation’s history. Consistent with the steadfast job market is the acceleration in wage growth which is closer to 3% compared with 2% throughout much of the recovery. U.S. manufacturing sector is showing signs of improvement with higher PMI data and improved industrial production. The key channel through which the British exit would harm the U.S. economy is through financial markets. But stock prices and credit spreads, which did suffer in the immediate wake of the vote, have recovered. How does EZU (Eurozone) look to you right now? Are there any catalysts that jump out at you as being key to driving the pushing higher in the months ahead?The estimate from economists is that GDP will be about a quarter point lower a year from now and about a half a percent five years from now for EU after the Brexit. However, we believe that a lot of the downside risk has been reflected in the equity market prices by now. Valuation and sentiment signals have improved recently for EZU. We expect that the ECB will deploy all policy instruments if necessary to boost the economy, including expanding asset purchases, injecting additional liquidity support, or lowering interest rates. |
| January 20, 2016 |
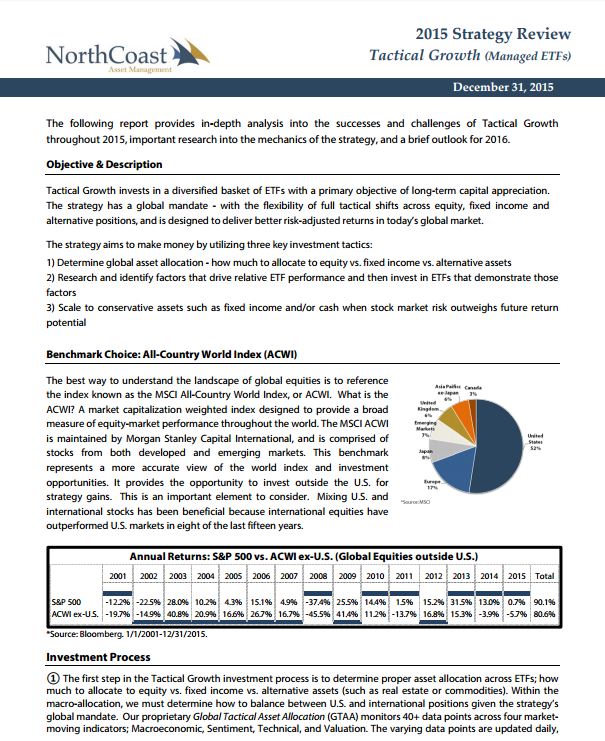
The following report provides in-depth analysis into the successes and challenges of Tactical Growth throughout 2015, important research into the mechanics of the strategy, and a brief outlook for 2016. Click here for the full report.
|
| December 16, 2015 |
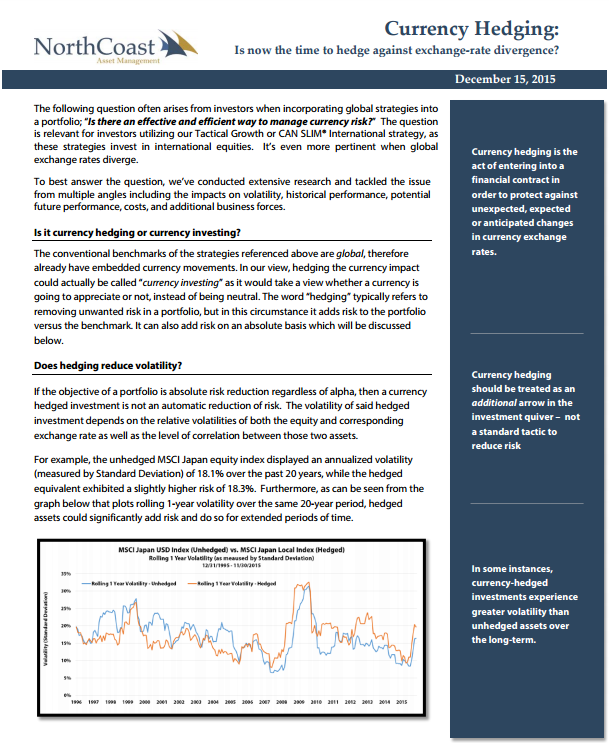
The following question often arises from investors when incorporating global strategies into a portfolio; “Is there an effective and efficient way to manage currency risk?” The question is relevant for investors utilizing our Tactical Growth or CAN SLIM® International strategy, as these strategies invest in international equities. It’s even more pertinent when global exchange rates diverge. To best answer the question, we’ve conducted extensive research and tackled the issue from multiple angles including the impacts on volatility, historical performance, potential future performance, costs, and additional business forces. Click the image link below for the full report.
|
| December 1, 2015 |
Tactical Growth increased exposure to EWJ (Japan) and IVV (S&P 500), while it added EWU (United Kingdom) as global equity outlook increased throughout November. Stronger macroeconomic data with supportive labor markets and increased consumer sentiment provided conviction to add EWU to the strategy. |
| November 2, 2015 |
After the dust settled following a few rocky months of market volatility, conviction swayed away from emerging markets and back toward developed markets such as the U.S and the Eurozone. Over the course of October, Tactical Growth removed exposure to EEM (emerging market equities) and EMB (emerging market bonds) as as macro-economic signals showed signs of deterioration in emerging markets. Exposure in IVV (U.S. large-cap equities) was reduced earlier in the month due to lower macroeconomic signals after the quick equity rebound. The available cash was put to work in IJH (U.S. small-cap equities) and EZU (Eurozone), as the outlook in developed markets increased throughout the month. |
| October 2, 2015 |
Tactical Growth ended September with equal exposure to U.S. and international equities and 7% exposure to fixed income to hedge against current market risks. The strategy was highlighted in the recent edition of the Investor’s Business Daily® - Click here to read the report. |
| September 11, 2015 |
After a five-month price decline, NorthCoast seeks to take advantage of current valuations by purchasing EEM (Emerging Markets) as technical and macroeconomic indicators turn positive. The position replaces exposure to EPP (Pacific ex- Japan). EPP experienced a similar drawdown over the last five months and was liquidated as it reached its designated sell-stop coupled with a diminished future return potential. |
| August 18, 2015 |
After being a strong and profitable position over the last two years, Tactical Growth sold its remaining stake in IJR as the economic outlook (macro, valuation, and sentiment signals) in U.S. small-cap equities weakened relative to Eurozone equities. Therefore, the sell in the position was replaced with a 5% increase to EZU. Recent PMI manufacturing data in Europe indicated economic activity is accelerating more than in other areas, coupled with strengthening sentiment, technical and valuation indicators. |
| July 23, 2015 |
Another reduction in IVV occurred as our outlook in U.S. equities weakened relative to equities in Japan (EWJ). Valuation, macro and sentiment signals all dropped to negative territory. The reduction in U.S. equity exposure paved the way for an increased allocation to EWJ, given its relatively bullish technical, sentiment, macro and valuation signals in our ETF selection model. EWJ should benefit from Japanese pension plan reallocation from fixed income to equities, massive asset purchasing by Bank of Japan, low interest rate environment and improving corporate governance of Japanese firms. |
| July 1, 2015 |
In part to its exposure to international equities, Tactical Growth has kept pace with its global benchmark in 2015. Increased exposure to the Eurozone and a modest holding in fixed income has provided steady returns for strategy. |
| June 23, 2015 |
Economic activity in the eurozone grew at the fastest pace in four years in June, providing the latest sign that a recovery in the region is gaining traction. This news provides conviction in the Eurozone just days after Tactical Growth added 5% to its position in IEV (iShares Europe ETD), increasing exposure to the region from 18% to 23%. |
| June 4, 2015 |
Given the current market conditions, our cash scaling model indicates a modestly bullish outlook on U.S. and international equity markets with a targeted investment level at around 90%. Instead of holding the remaining assets in cash equivalents, effectively yielding 0%, Tactical Growth holds a minor position in a 10+ Year Credit Bond ETF (CLY). With a current yield of 4.3%, the position boosts income to the portfolio. With the recent price decline in CLY, our valuation indicator is strong for the holding. |
| June 2, 2015 |
Over the month, Tactical Growth reduced U.S. equity exposure (IVV, IJR) and increased its positions in the Eurozone (EZU). U.S. equities still remain the top holding as CIO Patrick Jamin explains, "Out of all of the global economies, the U.S. economy has showed the most consistent strength." |
| May 20, 2015 |
Market outlook weakened in our U.S. investment model as stocks reach an all-time high, signaling a decrease in equity exposure. Therefore, Tactical Growth reduced IJR by 5%. |
| May 13, 2015 |
Another 5% reduction in IVV occurred as our outlook in U.S. equities weakened relative to our positive signals in the EZU (Eurozone). Momentum continues to improve in Europe with an attractive entry level. Therefore, a 5% buy in EZU replaced the 5% sell in IVV. |
| May 4, 2015 |
Large cap U.S. stocks (IVV) remained the top holding in Tactical Growth, complemented with stakes in small-cap (IJR) and mid-cap (IJH) U.S. equities. “Small caps will benefit more from a strengthening U.S. economy since small companies are more U.S. centric,” says CIO, Patrick Jamin. However, the exposure in U.S. equities were reduced as our outlook for U.S. equities slightly diminished on weakened macroeconomic data. A small position in CLY (10+ Year Credit Bond) was added to increase yield opportunity in the meantime. |
| April 6, 2015 |
Tactical Growth shifted global allocation in March as it increased exposure to Japan (EWJ) and the Pacific ex Japan (EPP) and reduced exposure to large and mid-cap U.S. equities (IVV/IJH). The strategic change comes as U.S. valuations draw concerns while outlook for international equities continues to improve. |
| March 3, 2015 |
Tactical Growth liquidated its position in EWJ (Japan), added EWC (Canada) as macroeconomic and sentiment data points show strength in the country. The strategy also reduced exposure in U.S. equities (IVV, IJH, and IJR) with valuation reaching new high levels. |
| February 17, 2015 |
Outlook for U.S. equities weakened with our valuation indicators showing cause for concern as stocks reach another all-time high. Tactical Growth reduced its exposure by 2% across each of its U.S. equity holdings, IVV, IJH, IJR. |
| February 3, 2015 |
Weakness in Japan’s corporate sector is increasingly evident, even after two years of quantitative easing efforts to boost the economy. Despite the effort, private investment decreased and key economic indicators remain weak. Tactical Growth sold its 7% holding in EWJ as our score in the position turned negative. The position was replaced with EMB and EWC. Macroeconomic indicators of leading business development and industrial production in emerging markets are improving. And with a relatively attractive yield in the position, the strategy added exposure. It also added EWC as Canadian sentiment and macro factors improve. |
| February 2, 2015 |
As 2015 gets underway, international equities provided a boost to counteract the drop in U.S. holdings. Tactical Growth continued to favor equities for the near-term and increased equity exposure to 100%, from 85% in December. The strategy dropped its three fixed income positions (MBB, HYG, CLY) to increase allocations for large-cap (IVV) and small-cap (IJR) U.S. equities. |
| January 20, 2015 |
Over the course of a week, market outlook increasingly turned bullish, leading Tactical Growth to sell its three fixed incomes in CLY, HYG, and MBB, and increase exposure to Europe (IEV) and Small-Cap Equities (IJR). Valuations were a driving force behind the positive outlook. |
| January 8, 2015 |
2014 Strategy Review -- Click here for the full report: http://www.northcoastam.com/pdf/strategies/2014-Strategy-Review-TacticalGrowth.pdf |
| January 6, 2015 |
Tactical Growth ended the year in positive territory, but with its high exposure to international equities, the strategy struggled as global stocks underwhelmed and small-cap equities significantly underperformed their large-cap counterparts. The strategy was kept positive by its large holding in IVV (S&P 500 Large-Cap ETF). |
| December 2, 2014 |
After conducting additional research into specific regions, Tactical Growth sold its EFA position and concentrated the weighting into EWJ (Japan), EPP (Pacific ex-Japan), and EZU (European Union). As international markets remained unstable, the strategy increased its U.S. Large-Cap and Mid-Cap exposure in IVV and IJH. |
| November 5, 2014 |
Tactical Growth experienced multiple allocation shifts. With October’s volatility and changing trends in market posture, the strategy removed its exposure to Europe (IEV) and Emerging Markets (EEM) while taking stake in fixed income with high-yield (HYG) and 10+ year credit (CLY) bond ETFs. The strategy is positioning for further volatility and uncertainty as 2014 concludes.
|
| October 1, 2014 |
Tactical Growth complements its U.S. holdings with a healthy dose of foreign ETFs. Over the past fifteen years, mixing U.S. and international stocks has been beneficial because international markets have fared better. Our portfolios are well-diversified between U.S. and international stocks. |