
"Lighthouses don’t go running all over an island looking for boats to save; they just stand there shining" ~ Anne Lamott
I have always loved the lighthouse metaphor for what we do at NorthCoast. It’s my belief that managing money requires guiding lights or foundational principles to help navigate the never-ending day-to-day financial crosswinds. This year the storms we’ve faced have been historically intense with unprecedented market, economic, and political action and reaction:
- The steepest and quickest bear market decline ever - It took just 16 trading days for the Dow Jones to push into bear market territory and a 20% decline, with the S&P 500 and Nasdaq Composite Indexes one trading day behind. On an aggregate basis from peak to trough, the S&P 500 declined 34% in only 33 calendar days thanks to the Coronavirus panic. Compare that to the average bear market correction, which has historically taken at least 11 months to decline 30%.
- The highest volatility reading on record - The CBOE Volatility Index, also known as the VIX, measures 30-day forward-looking volatility via options. In March, the VIX hit an all-time high of 85.47, eclipsing its previous record high of 80.86 set during the Great Recession.
- The first time crude oil futures contracts pushed into negative territory - We also witnessed history on April 20, when front-running crude oil futures contracts for West Texas Intermediate (WTI) turned negative. It's not as if WTI futures dipped only a few cents into negative territory. Although the stay below $0 was relatively brief, WTI futures reached minus $40 per barrel before rebounding. Producers were effectively paying buyers to take the product off their hands.
- The fastest recovery from a bear market bottom to new highs - Aside from enduring the steepest bear market drop in history, investors were also privy to the fastest recovery to new all-time highs. After bottoming on March 23, it took less than five months for the S&P 500 to rise to a fresh closing high. The Nasdaq Composite did even better, with the index recording more than three dozen record closing highs in 2020.
- The first-ever $2 trillion public company in the U.S. - Lastly, we witnessed the first publicly traded company in the U.S. to hit a $2 trillion market cap: Apple. Apple was already doing well heading into late July. Its fiscal third-quarter earnings report showed surprising double-digit sales growth from the prior-year period, with services revenue leading the way during an especially difficult quarter for businesses. However, it was the company's announcement of a 4-for-1 stock split that appeared to create the euphoria that sent Apple to a market cap of $2.3 trillion before retreating.
In a normal year, any of these market events could be the lead story. But they are dwarfed by the economic, political, and medical stories of 2020: the upcoming election, COVID vaccines, the Fed’s declaration of war against a recession, and Congressional stimulus packages. Given all that’s happening, I want to take time to highlight a few lighthouses that we use as these storms continue to roll in.
First, Data and Discipline will Outperform Instinct and Intuition. This is a cornerstone belief for us and has been on display every day since the storms rolled in during February. Markets move for four reasons: Macroeconomic (+/- change in economic activity and production), Sentiment (optimism/pessimism for future economic conditions), Technicals (+/- change in asset prices) and Valuation (what are people paying for future earnings). We measure over 40 signals from these four dimensions every day, then adjust portfolios based on whether these data points indicate future gains or potential losses. We discuss this exercise in the NorthCoast Navigator, distributed monthly to our clients.
However, as referenced above this market has many historical firsts. So if you use models built from 75 years of market history what do you do when you are seeing something for the first time? Well for us, we do not give up on data; we simply collect new and more relevant datasets to help us navigate. Below are some examples of data we’ve been using to complement our foundational thinking: Chart 1: How much global governmental support is at play? (A LOT!!); Chart 2: How is high frequency economic activity acting? (Improving still!); and Chart 3: Seven-day averages for COVID cases and deaths (better but not great).
Considering all this, we are optimistic about the market over the next 6 months.
CHART 1
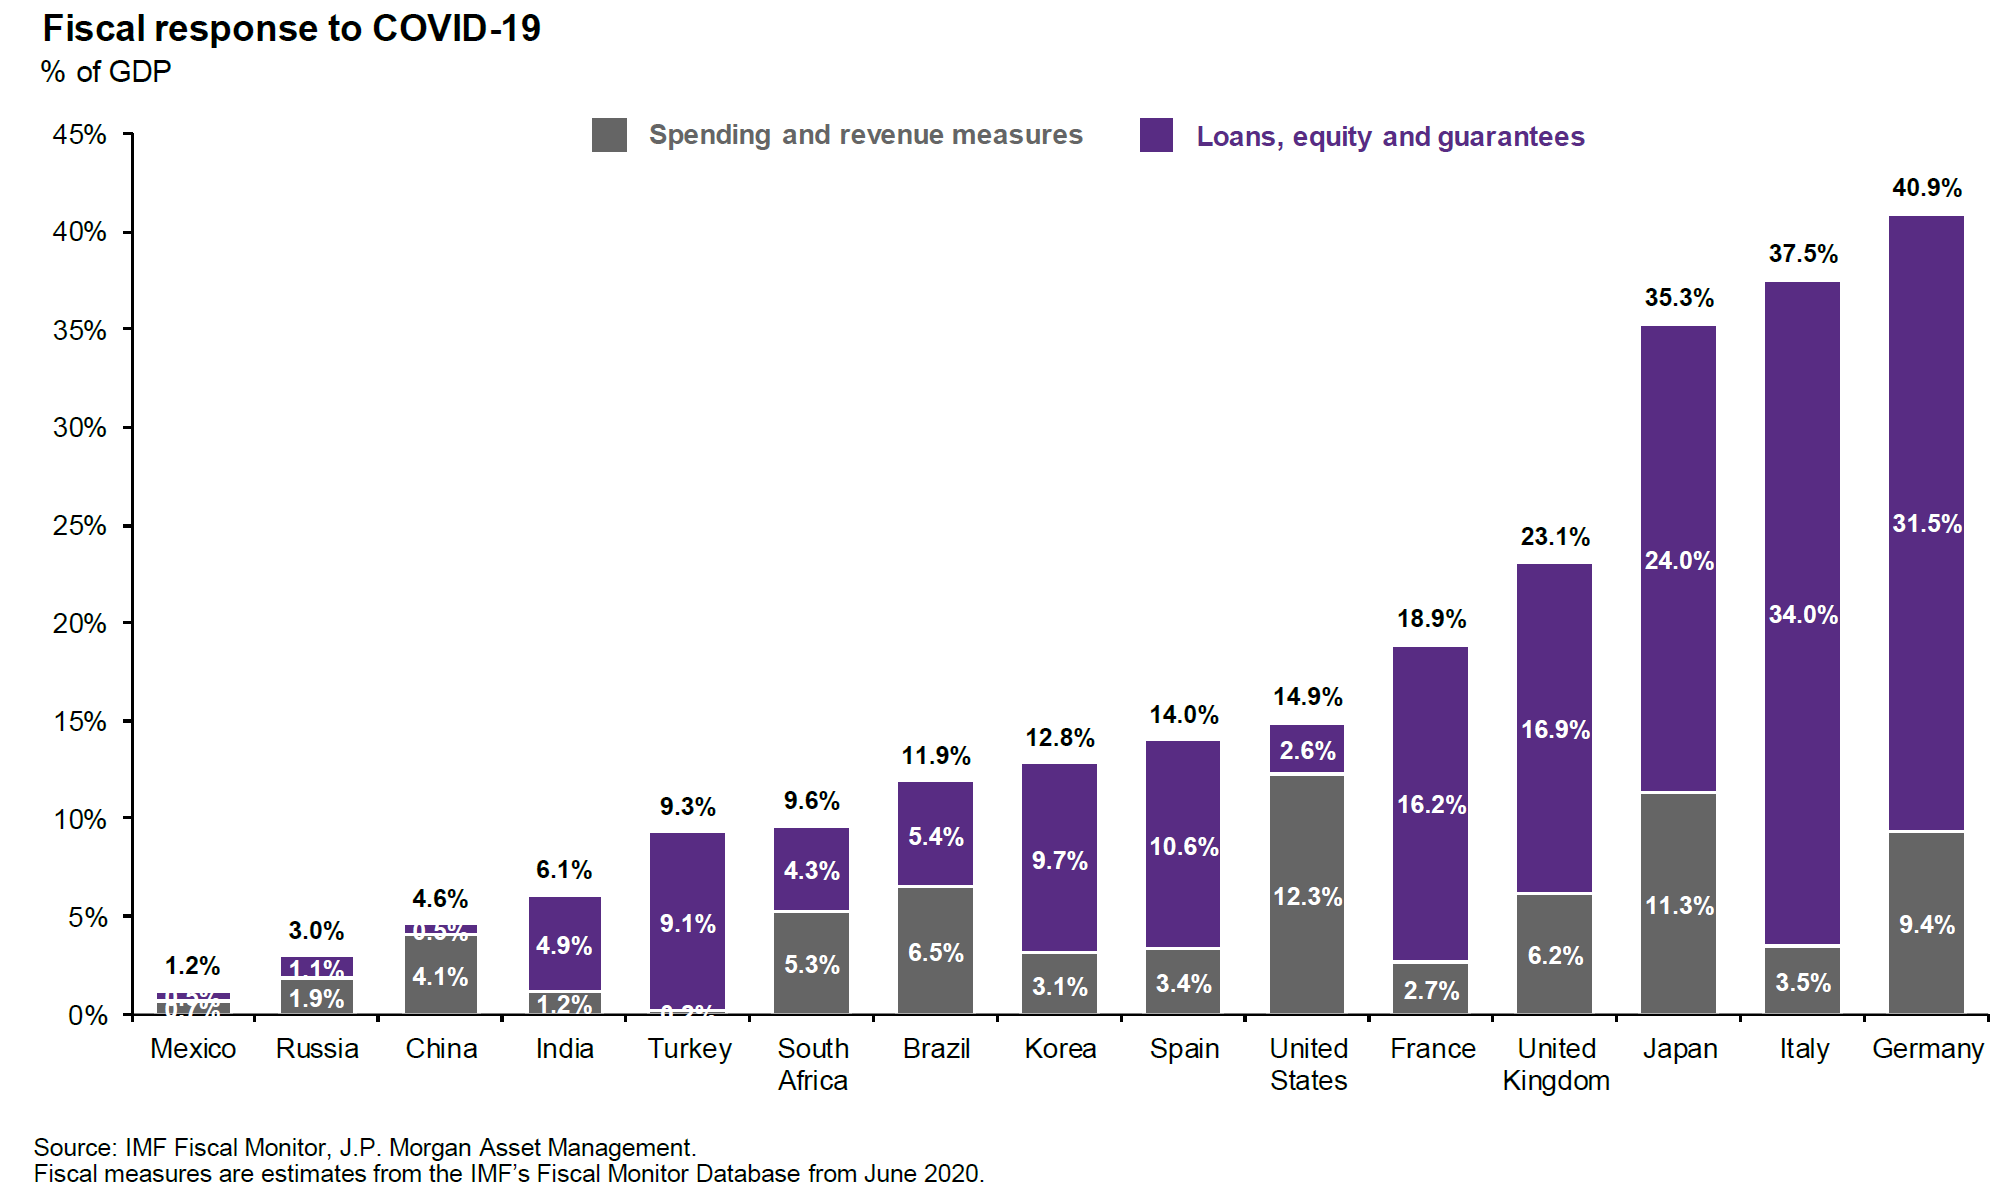
CHART 2
High-Frequency Data (Year-over-Year % Change)*
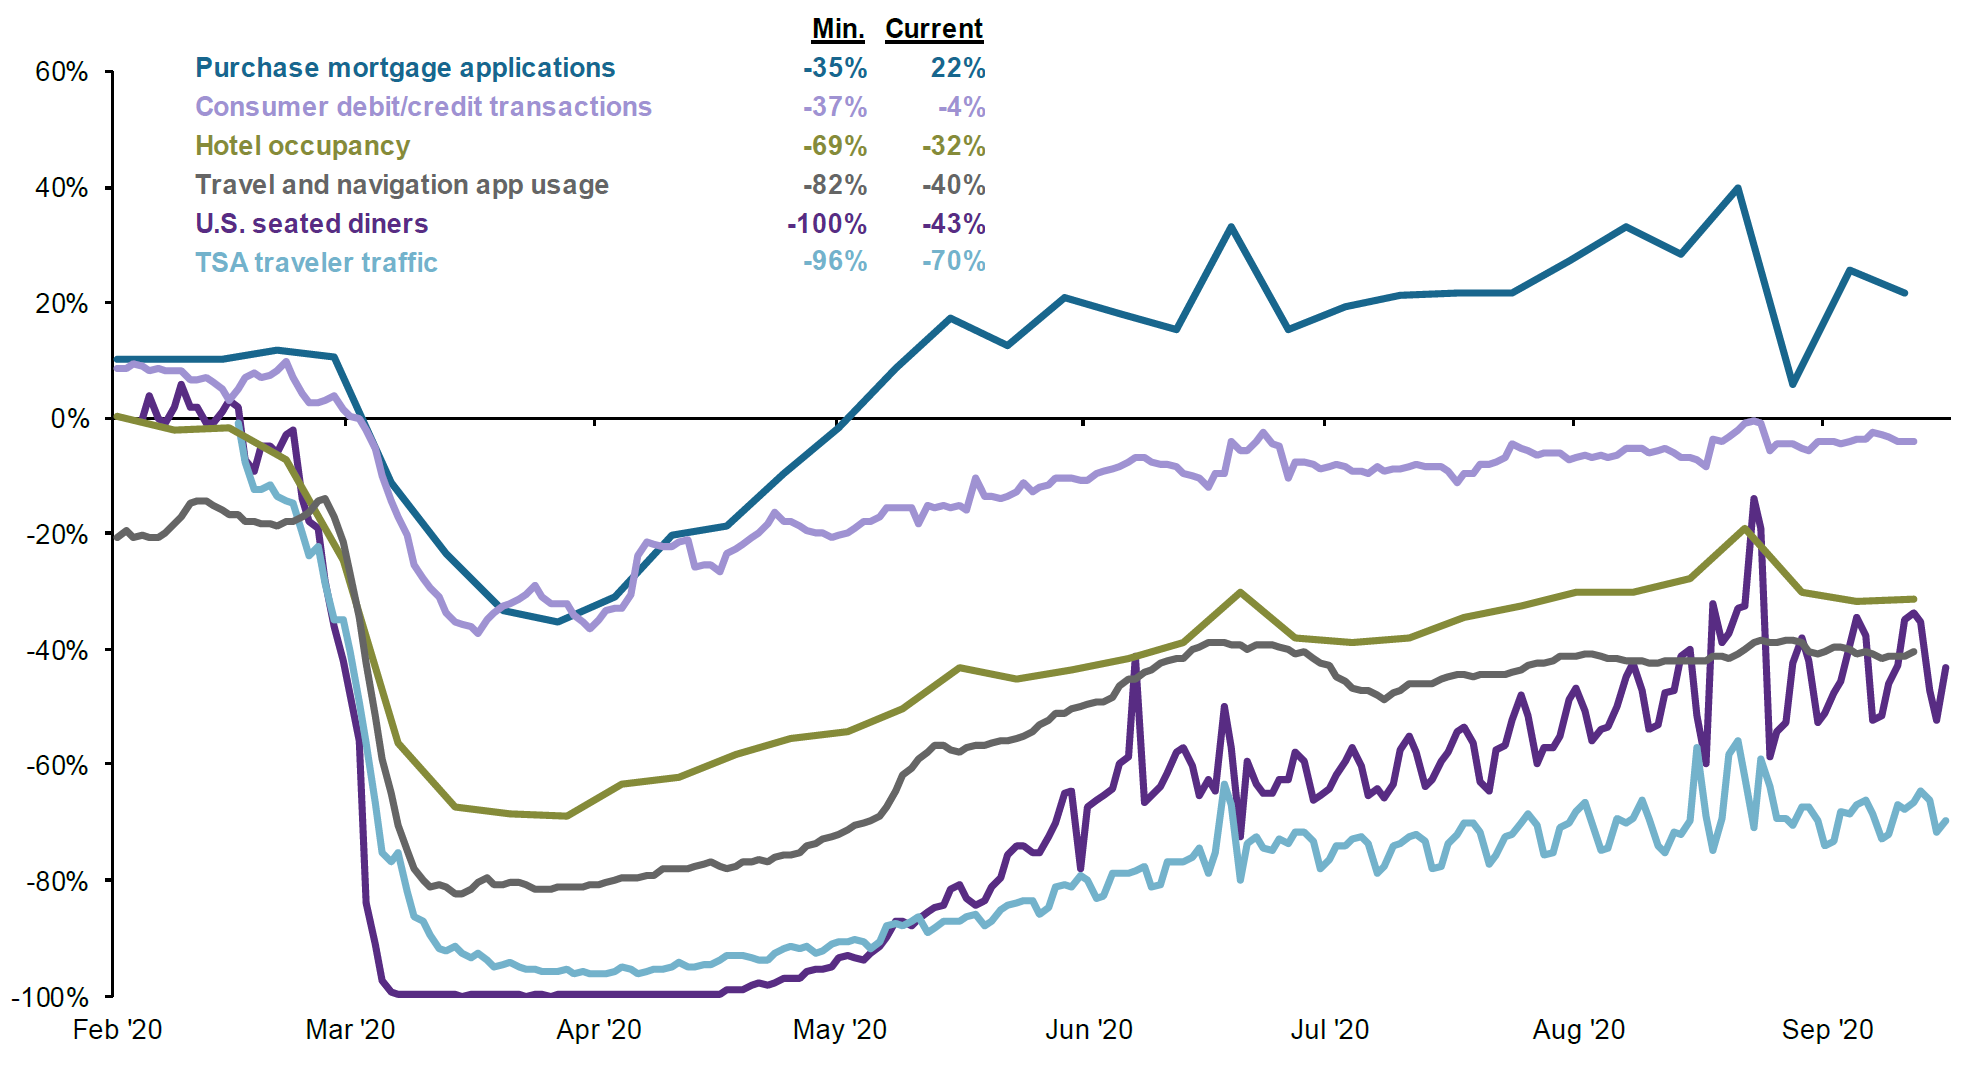
Source: App Annie, Chase, Mortgage Bankers Association (MBA), OpenTable, STR, Transportation Security Administration (TSA), J.P. Morgan Asset Management. *App Annie data is compared to 2019 average and includes over 600 travel and navigation apps globally, including Google Maps, Uber, Airbnb and Booking.com.
CHART 3
Change in Confirmed Cases and Fatalities in the U.S. (7-day moving average, as of 9/30/20)
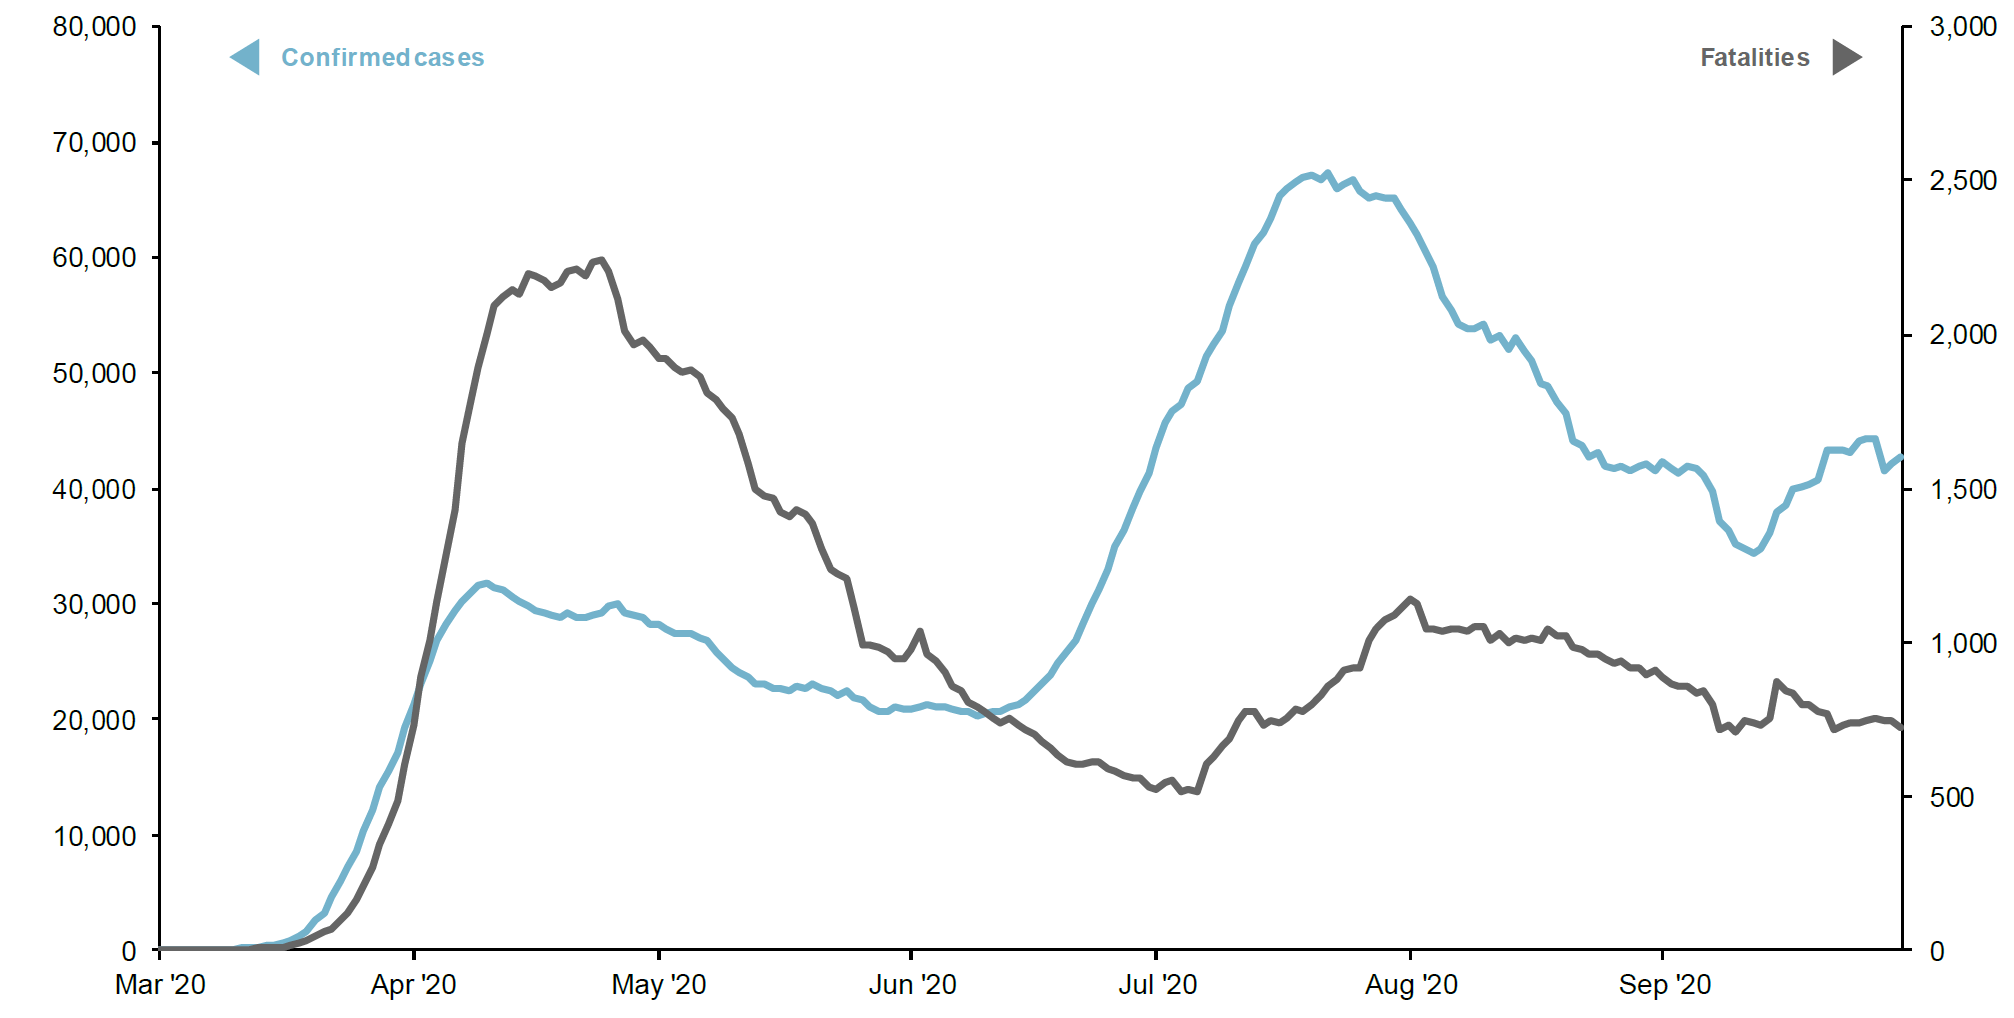
Source: Johns Hopkins CSSE, J.P. Morgan Asset Management.
Second, A Stock’s Performance Over Time Will be a Reflection of its Underlying Factors. We use 21 factors to measure whether a stock is a good investment or not - things like earnings growth, profit margin expansion, whether institutions are shorting the stock, is it cheap or expensive, is management buying or selling their stock, etc. This has been a very productive way to differentiate winners or losers over time.
This does not mean that it works all the time, however. I wish it did! There is no easy money in the stock market. It means instead you have to be patient and disciplined because it’s not always going to work for you. And for about 18 months this has been quite a challenge. Why? Because only one factor has dominated performance – market cap, or, put more simply, size.
Would you put $226,000 of your $1 million into five stocks? Well if you want your portfolio to keep pace with the S&P 500, that’s what you have to do right now because the top five largest stocks are currently 22.6% of the S&P 500. It is an idea that doesn’t work out well historically and one of the reasons we are underweight these popular names. Can you believe that four out of the top five stocks in terms of market cap from 2000 are still below their prices from 20 years ago? (GE $58 vs $6, CSCO $77 vs $38, XOM $40 vs $34, PFE $48 vs $36). Incredible.
Weight of the Top 5 Largest Stocks in the S&P 500
(% of market capitalization of the S&P 500)
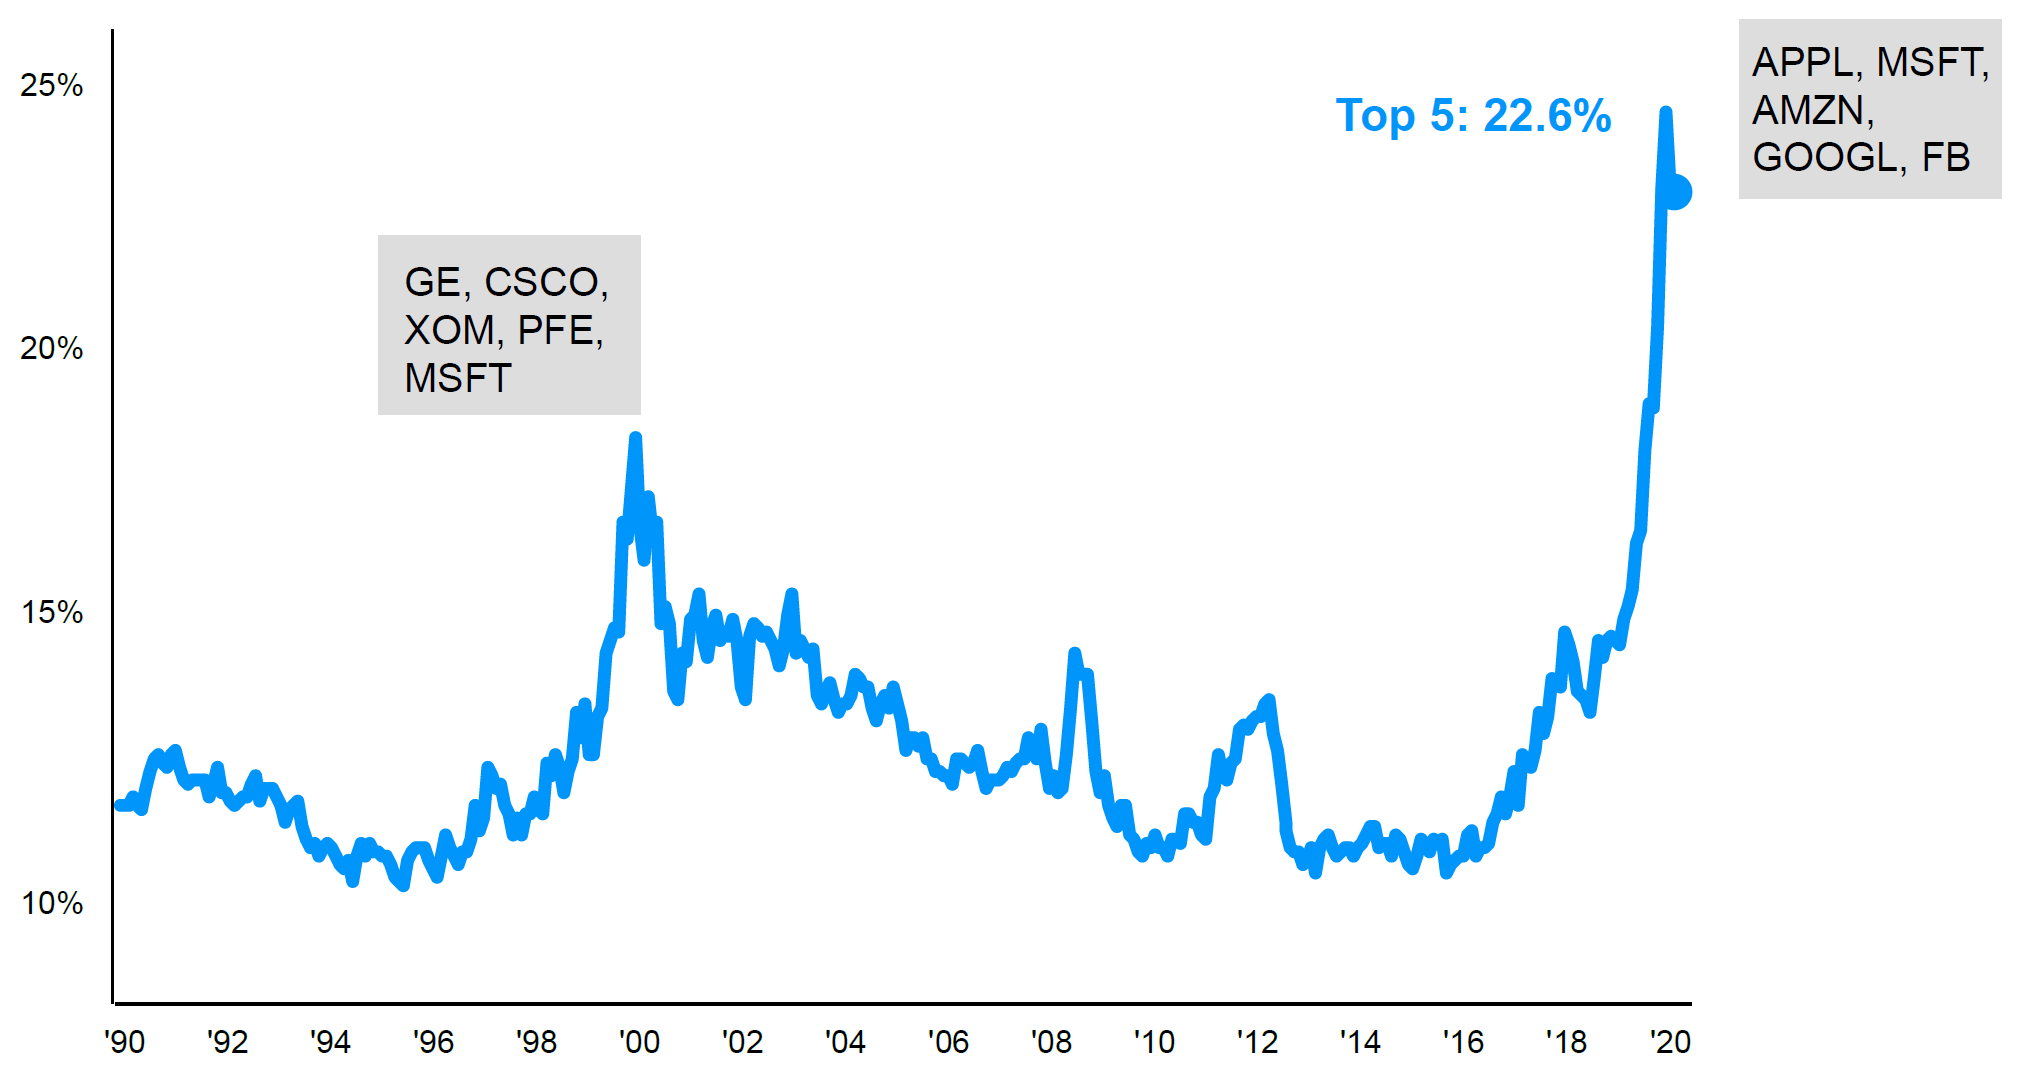
Source: FactSet, Standard & Poor’s, J.P. Morgan Asset Management.
Information Technology sector’s peak weight in the S&P 500 during the Tech bubble was in 8/31/2000, and peak EPS contribution to the S&P 500 was in 10/31/2000.
Another way of looking at this is to compare the performance of the cap-weighted S&P 500 (which is very influenced by size) to the exact same stocks equal-weighted:
S&P 500 YTD: +5.6%
S&P 500 Equal Weight YTD: -4.8%
Source: Bloomberg
That 10% difference is attributable to nothing else but size. Strikingly similar, small-cap stocks measured by Russell 2000 are even worse off at -9% year-to-date. This is exactly the run up we saw in 1999 when big stocks dominated and look what happened 5 years later – equal weight beat cap-weighted by +47%!
Total Returns as of 12/31/2004
|
1 year |
3 year |
5 year |
|
|
S&P 500 Index |
10.88% |
11.13% |
-10.99% |
|
S&P 500 Equal Weight |
16.48% |
28.76% |
36.02% |
Source: Bloomberg
Now is the time to be consistent and disciplined ‒ we have seen this movie before. Mean reversion is a powerful market force. It’s clear to me that investors who had significant losses from 2000-2003 are unfortunately doomed to repeat those mistakes in the current environment by chasing stocks that don’t have the ingredients for long-term success.
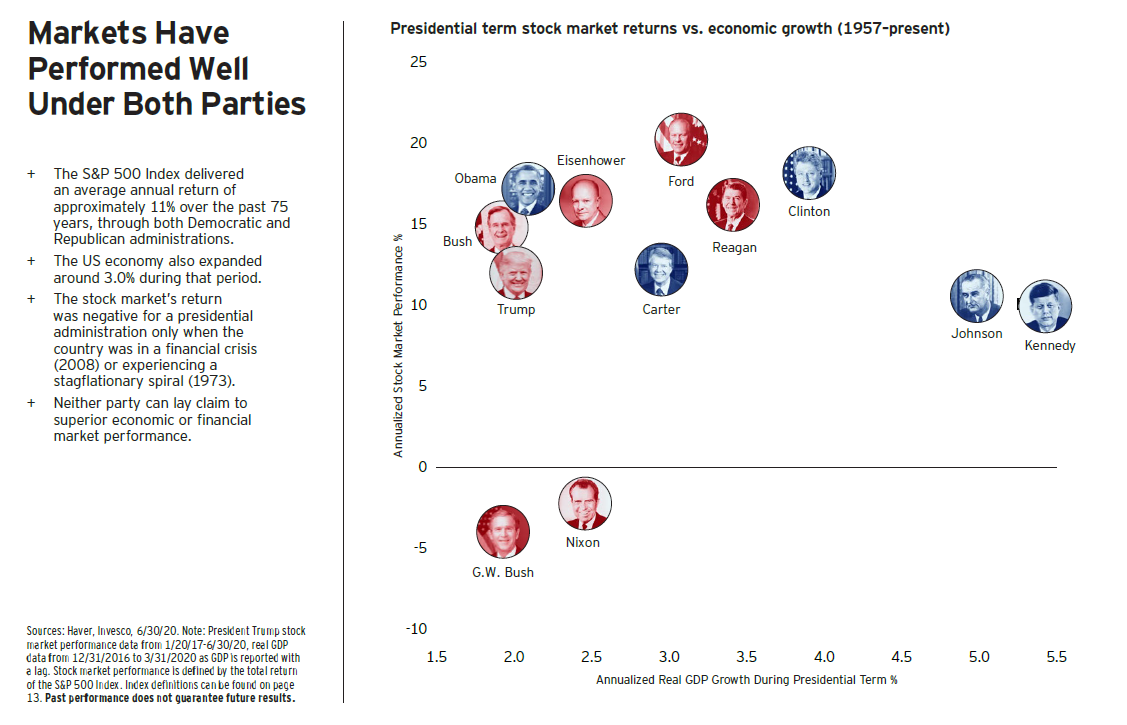
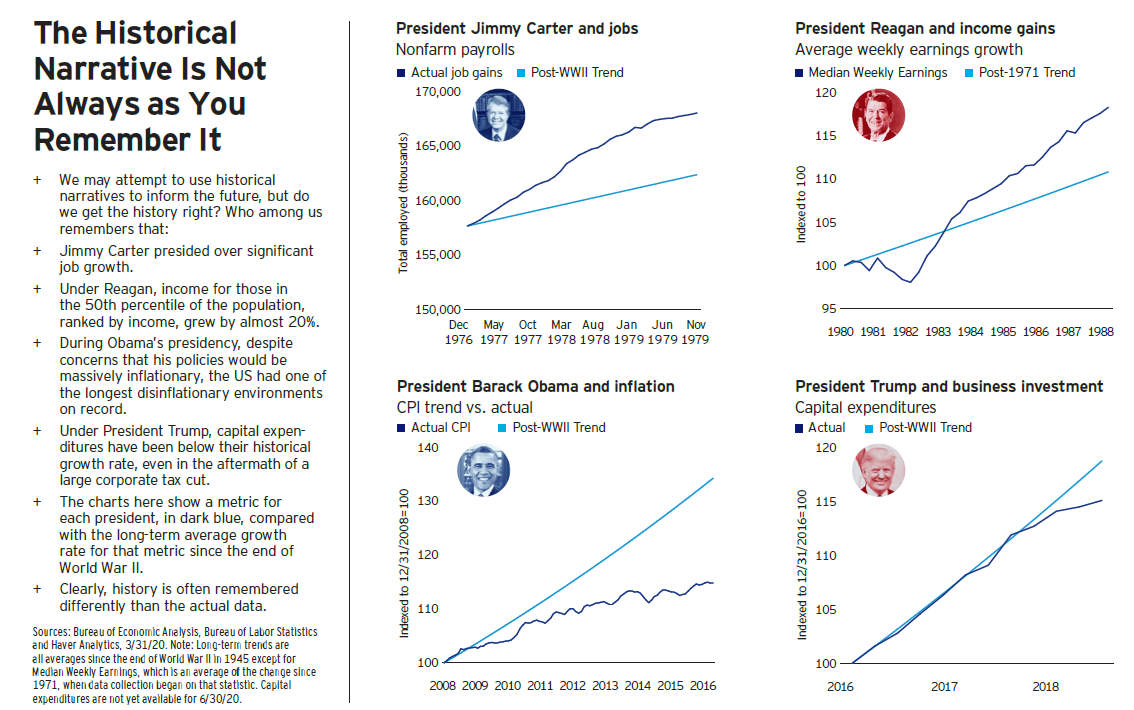
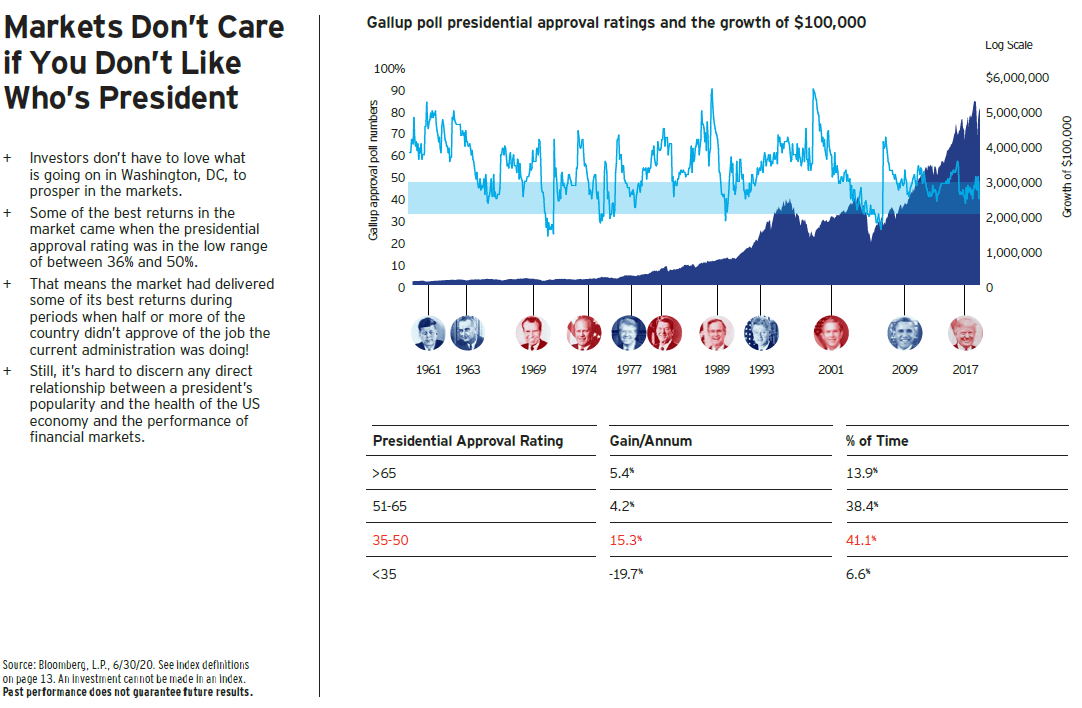
The third and final lighthouse for this letter is Election Outcomes Don’t Mean That Much to the Stock Market. Though the election will continue to compete with the Coronavirus for news dominance over the next four weeks (and probably longer if some states are contested), we all need to try to resist grand, linear (Linear = if Candidate X wins, this will then happen) arguments about what this means to the market. Why? Because the market doesn’t really care (hats off to some spectacular visuals on this from Invesco in the Appendix below). The market cares about the dimensions I discussed above – the economy, the valuation, the technicals, and the sentiment of the participants. That is where we will continue to keep our attention.
To provide some historical context, I was in Portland, Oregon during our last election and remember watching Dow futures down 1000 points upon the announcement of President Trump’s victory. It was so unnerving to clients that we put out a bulletin at the time.
To be sure, there will be anxious moments ahead. Volatility is rising and COVID cases remain stubbornly high, but remember the market will very quickly move past the news stories on to what matters to investors. We remain focused on the lighthouses which have provided the foundational guidance for our investment decisions throughout this turbulent year.
As always, thank you for entrusting us with your investments. I hope this letter finds you and yours healthy, safe and strong. 2021 is almost here.
Appendix
###
Important Disclosures
The information contained herein has been prepared by NorthCoast Asset Management LLC (“NorthCoast”) on the basis of publicly available information, internally developed data and other third party sources believed to be reliable. NorthCoast has not sought to independently verify information obtained from public and third party sources and makes no representations or warranties as to accuracy, completeness or reliability of such information. All opinions and views constitute judgments as of the date of writing without regard to the date on which the reader may receive or access the information, and are subject to change at any time without notice and with no obligation to update. This material is for informational and illustrative purposes only and is intended solely for the information of those to whom it is distributed by NorthCoast. No part of this material may be reproduced or retransmitted in any manner without the prior written permission of NorthCoast. NorthCoast does not represent, warrant or guarantee that this information is suitable for any investment purpose and it should not be used as a basis for investment decisions. © 2020 NorthCoast Asset Management LLC.
PAST PERFORMANCE DOES NOT GUARANTEE OR INDICATE FUTURE RESULTS.
This material should not be viewed as a current or past recommendation or a solicitation of an offer to buy or sell any securities or investment products or to adopt any investment strategy. The reader should not assume that any investments in companies, securities, sectors, strategies and/or markets identified or described herein were or will be profitable and no representation is made that any investor will or is likely to achieve results comparable to those shown or will make any profit or will be able to avoid incurring substantial losses. Performance differences for certain investors may occur due to various factors, including timing of investment. Investment return will fluctuate and may be volatile, especially over short time horizons.
INVESTING ENTAILS RISKS, INCLUDING POSSIBLE LOSS OF SOME OR ALL OF AN INVESTMENT.
The investment views and market opinions/analyses expressed herein may not reflect those of NorthCoast as a whole and different views may be expressed based on different investment styles, objectives, views or philosophies. To the extent that these materials contain statements about the future, such statements are forward looking and subject to a number of risks and uncertainties.