
An Election and a Bullwhip
The first presidential debate occurred at the end of September and more officially kicked off what will be a contentious sprint to November. With debates scheduled for mid- and late October, campaign rhetoric and polling will only intensify. We are expecting spikes in market volatility as a result of this intensification and public attention, but hold steadfast in the statistical analysis of past elections. This analysis includes 23 past election years, 17 of which were positive years for U.S. equities. Furthermore, there is no strong correlation between market returns and which political party holds the executive office. While we are closely watching for significant events that may cause deviations from these conclusions or effects on sentiment, we are more intently focused on the progress of the medical crisis, the trajectory of the U.S. economy and market trends.
In mid-September, the Federal Reserve weighed in on the current economic outlook. They signaled that the near-term recovery from the reduction of mobility restrictions may mask some deeper and longer lasting issues with the economy. Jobless claims have held steady in recent weeks showing that employment gains may be stabilizing after recovering over half of the job losses in spring.
One particular near-term boost to the economy has been a “bullwhip effect.” Softening demand in the first half of the year caused manufacturers to reduce production and rely on existing inventory to meet the lower demand. This has a negative effect on GDP because demand is being met with previously produced supply and new supply is not being produced. As demand picks up, however, production needs to accelerate quickly to both meet the new, higher demand as well as make up for the shortage caused by the reduction in production. This is the bullwhip effect and while temporary it can provide a strong boost to the economy, increasing production throughout entire supply chains.
Emerging market countries are accounting for the majority of new COVID cases globally. However, some developed European countries are experiencing second waves including France, Spain and the UK. For now, no secondary lockdowns have been announced. Canada is also reporting an uptick in cases. U.S. new case numbers are still high at the moment but data points such as infection rate and death rate are ameliorated in most areas. Deaths in the developed countries remain low relative to the first wave of infections due in part to improved understanding and implementation of care as well as more young individuals getting infected relative to elderly, at-risk individuals. Regarding a vaccine, health officials communicated the difficulty of mass producing and distributing a vaccine to the general public, so there may be a long delay between final approval and public access.
The S&P 500 finished Q3 in the black with a quarterly return of approximately 8.8%, despite being down -3.8% in the month of September. We maintained a similar investment level as last month in both our tactical Domestic and International flagship programs. We are going to be watching for the latest economic data, any further notes from the Federal Reserve and signs of reversion from mega-cap tech stock gains .
By the Numbers*
U.S. Equities (S&P 500 Index) | 5.1%
International Equities (MSCI ACWI ex-U.S.) | -5.4%
U.S. Bonds (Barclays U.S. Aggregate Bond Index) | 6.8%
Global Bonds (JP Morgan Global Aggregate Bond Index) | 5.7%
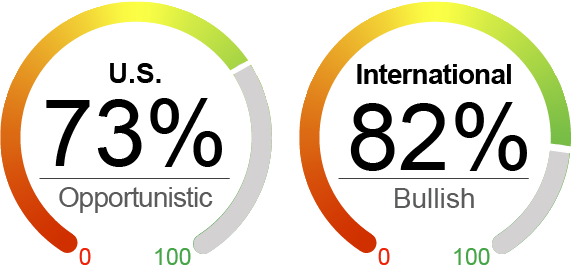
The NorthCoast Navigator is a market barometer displaying NorthCoast's current U.S. equity outlook. This aggregate metric is determined by multiple data points across four broad market-moving dimensions: Technical, Sentiment, Macroeconomic, and Valuation. The daily result determines equity exposure in our tactical strategies.
As of 9/30/2020. Data provided by Bloomberg, RBC, NorthCoast Asset Management.
*Source: Bloomberg, NorthCoast Asset Management.
|
Negative Indicator |
Neutral Indicator |
Positive Indicator |
Neutral Indicator |
|
Valuation After the negative price action in September, valuations improved slightly. However, they are still stretched with P/E ratios around 26.1. Low interest rates have allowed for some justification of these high valuations, but the coming earnings season will be insightful as to the pace of recovery. |
Sentiment The University of Michigan Consumer Sentiment Survey improved from last month to 78.9. For perspective, the average of the survey from July 2019 to February 2020 was 95.9. We are still seeing improvement, particularly in homebuilder sentiment and Manufacturing PMI. |
Technical Technical indicators did soften in September due to overall losses for U.S. equities. Longer-term trends are still looking strong, especially considering September was the first monthly loss since March. The S&P 500 sits even with its 50-day moving average (MA), but above its 100- and 200-day MA’s. |
Macroeconomic The Bullwhip effect may have an outsized positive influence on upcoming GDP numbers. However, this effect is likely to be temporary. Despite gains in the job market in recent months, it appears to be stagnating as new weekly jobless claims have decreased only slightly. |
Important Disclosures
The information contained herein has been prepared by NorthCoast Asset Management LLC (“NorthCoast”) on the basis of publicly available information, internally developed data and other third party sources believed to be reliable. NorthCoast has not sought to independently verify information obtained from public and third party sources and makes no representations or warranties as to accuracy, completeness or reliability of such information. All opinions and views constitute judgments as of the date of writing without regard to the date on which the reader may receive or access the information, and are subject to change at any time without notice and with no obligation to update. This material is for informational and illustrative purposes only and is intended solely for the information of those to whom it is distributed by NorthCoast. No part of this material may be reproduced or retransmitted in any manner without the prior written permission of NorthCoast. NorthCoast does not represent, warrant or guarantee that this information is suitable for any investment purpose and it should not be used as a basis for investment decisions. © 2020 NorthCoast Asset Management LLC.
PAST PERFORMANCE DOES NOT GUARANTEE OR INDICATE FUTURE RESULTS.
This material should not be viewed as a current or past recommendation or a solicitation of an offer to buy or sell any securities or investment products or to adopt any investment strategy. The reader should not assume that any investments in companies, securities, sectors, strategies and/or markets identified or described herein were or will be profitable and no representation is made that any investor will or is likely to achieve results comparable to those shown or will make any profit or will be able to avoid incurring substantial losses. Performance differences for certain investors may occur due to various factors, including timing of investment. Investment return will fluctuate and may be volatile, especially over short time horizons.
INVESTING ENTAILS RISKS, INCLUDING POSSIBLE LOSS OF SOME OR ALL OF AN INVESTMENT.
The investment views and market opinions/analyses expressed herein may not reflect those of NorthCoast as a whole and different views may be expressed based on different investment styles, objectives, views or philosophies. To the extent that these materials contain statements about the future, such statements are forward looking and subject to a number of risks and uncertainties.