Economic Recovery and Equity Rotation
The up-and-down Q1 2021 closed out on a positive note with U.S. equities booking gains, the S&P 500 +4.3% in March. That being said, the first quarter was not quite the return to normalcy that many had hoped for after the tumult of 2020. Right now, the story of 2021 is the changing narrative around momentum and growth stocks. At points last quarter the fervor surrounding these stocks seemed unstoppable, and even produced peculiarities such as the Game Stop saga. In mid-February the NASDAQ Composite (growth and tech-heavy) was outperforming the Dow Jones Average (more value heavy) by nearly 7%. Since then, that trend has reversed with tech and growth stocks falling while value has gained favor. One of the main drivers of growth stocks’ woes has been rising yields, which generally has a negative effect on these riskier stocks. The rise in value stocks can be attributed to the same reason driving yields higher: improved economic outlook. The positive outlook has signaled a broadening of the equity market’s rise, which had been concentrated in the tech sector for the past year. As it broadens, investors are rotating out of an arguably overvalued tech sector and into lagging value equities that are expected to catch up as the economy strengthens.
Equities rose in March on positive economic news regarding lower jobless claims and higher job creation. Consumer sentiment also rose after the disbursement of the most recent stimulus check and planned government spending packages. The spending packages would be aimed at projects, such as infrastructure, to further stimulate the economy, but there is an uphill battle facing these bills’ passages. Regardless, the strengthening of the economy is evident at this point, and investors’ rotation into value stocks is further substantiation.
In Mid-March the Federal Reserve kept interest rates anchored near zero and did not revise their forecast that rates will remain unchanged through at least 2023. They also raised their expectations for GDP growth and inflation while lowering unemployment estimates. The concerns of rising inflation still exist, and the question now is when and where inflation and yields will plateau. If inflation continues to rise past the Fed’s expectations, they may need to consider raising rates prematurely. This could have an adverse effect on economic growth since it would increase borrowing costs.
At present, we are seeing more positive signals than negative. The broadening of the equity market’s rise is encouraging and the technology sector’s lagging behind cyclicals and value is long overdue. The economy’s strength is also a major positive. Valuations are still holding back our investment levels in U.S. equities, and we remain at an opportunistic 78%. Valuations internationally remain relatively more attractive and we are 87% invested in our flagship international strategy.
By the Numbers (Year-to-Date)*
U.S. Equities (S&P 500 Index) | 6.1%
International Equities (MSCI ACWI ex-U.S.) | 3.5%
U.S. Bonds (Barclays U.S. Aggregate Bond Index) | -3.4%
Global Bonds (JP Morgan Global Aggregate Bond Index) | -4.5%
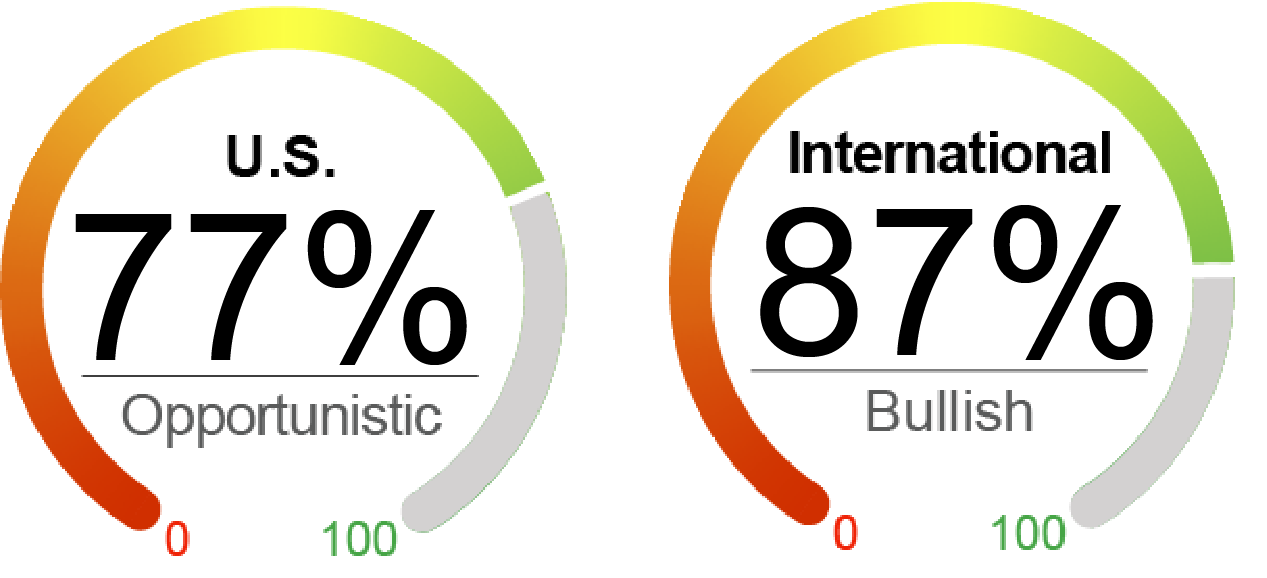
The NorthCoast Navigator is a market barometer displaying NorthCoast's current U.S. equity outlook. This aggregate metric is determined by multiple data points across four broad market-moving dimensions: Technical, Sentiment, Macroeconomic, and Valuation. The daily result determines equity exposure in our tactical strategies.
As of 3/31/2021. Data provided by Bloomberg, NorthCoast Asset Management.
*Source: Bloomberg, WSJ, NorthCoast Asset Management.
|
Negative Indicator |
Neutral Indicator |
Positive Indicator |
Positive Indicator |
|
Valuation With the rotation out of the tech and growth sectors, the relative valuation of this sector has improved slightly. Overall, however, valuations are generally still very high and equities appear overvalued. P/E ratios increased with the market rise from 30.88 at end of February to 32.43 at end of March. |
Sentiment Sentiment is still below its pre-pandemic levels, but it is at its highest level since the pandemic’s start. The University of Michigan consumer sentiment survey was up to 85 from 77 a month earlier. Stimulus and solid economic data, such as net job gains, are driving the rise. |
Technical Technical indicators remain positive. The broadening of the U.S. equity market’s gains is an encouraging sign of more general momentum throughout the market. At the end of the quarter, the S&P 500 sits comfortable above its main moving averages. Currently is 12% above the 200-day moving average. |
Macroeconomic Strong job numbers and rising sentiment will have hopefully had a knock-on effect of stronger consumer spending, a main driver of economic growth in the U.S. Income growth is expected to be slow for the time being, but net job growth is very encouraging. Proposed spending bills could further boost economic outlook, but their passages will be hard won in a divided Congress.
|
Important Disclosures
The information contained herein has been prepared by NorthCoast Asset Management LLC (“NorthCoast”) on the basis of publicly available information, internally developed data and other third party sources believed to be reliable. NorthCoast has not sought to independently verify information obtained from public and third party sources and makes no representations or warranties as to accuracy, completeness or reliability of such information. All opinions and views constitute judgments as of the date of writing without regard to the date on which the reader may receive or access the information, and are subject to change at any time without notice and with no obligation to update. This material is for informational and illustrative purposes only and is intended solely for the information of those to whom it is distributed by NorthCoast. No part of this material may be reproduced or retransmitted in any manner without the prior written permission of NorthCoast. NorthCoast does not represent, warrant or guarantee that this information is suitable for any investment purpose and it should not be used as a basis for investment decisions. © 2021 NorthCoast Asset Management LLC.
PAST PERFORMANCE DOES NOT GUARANTEE OR INDICATE FUTURE RESULTS.
This material should not be viewed as a current or past recommendation or a solicitation of an offer to buy or sell any securities or investment products or to adopt any investment strategy. The reader should not assume that any investments in companies, securities, sectors, strategies and/or markets identified or described herein were or will be profitable and no representation is made that any investor will or is likely to achieve results comparable to those shown or will make any profit or will be able to avoid incurring substantial losses. Performance differences for certain investors may occur due to various factors, including timing of investment. Investment return will fluctuate and may be volatile, especially over short time horizons.
INVESTING ENTAILS RISKS, INCLUDING POSSIBLE LOSS OF SOME OR ALL OF AN INVESTMENT.
The investment views and market opinions/analyses expressed herein may not reflect those of NorthCoast as a whole and different views may be expressed based on different investment styles, objectives, views or philosophies. To the extent that these materials contain statements about the future, such statements are forward looking and subject to a number of risks and uncertainties.