
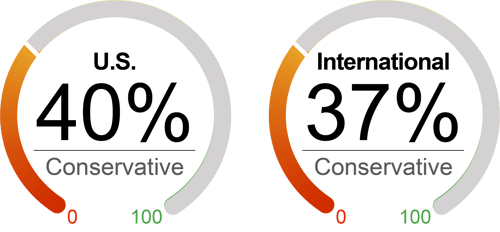
Current Equity Exposure |
 |
|
Markets advanced in January, driven by moderating inflation, China’s reopening, and hopes of a soft landing. However, we remain underweight equity in the short run as we believe such a rally is short-lived, and markets are vulnerable to negative surprises – policy uncertainties, declining earnings expectations, and worsening activity momentum. Despite cooling inflation, some recent economic data, including contracting PMIs, weakening consumer spending, soft homebuilders, and falling leading economic indicators, demonstrated weaknesses in business and consumer conditions. Also, we see central banks keeping monetary policy tight to combat high core inflation, rather than the market views for rate cuts sometime soon this year. |
The Factors |
|
Valuation
|
|
Sentiment
|
|
Technical
|
|
Macroeconomic
|
|
What's Driving the Markets?
China’s Reopening: Chinese stocks rallied in January with the optimism that domestic demand will recover after Beijing abandoned its zero-COVID policy. A Reuters survey forecasted that China’s economy would grow at the rate of 4.9% this year versus a rate of about 3% in 2022. We believe that China’s reopening will also benefit EM assets as China represents a significant portion (about 30%) of EM indexes. Also, growing Chinese demand will likely boost exports for other EM countries with strong links to China.
Corporate Earnings: The blended earnings decline for the fourth quarter for the S&P 500 was 5.0% as of January 27. We see a more challenging outlook with negative earnings revisions as 2023 progresses since 1) Corporate pricing power will likely start to decline with producer price disinflation (PPI fell 0.5% in December). 2) Supports from pent-up demand and consumer excess savings are dissipating. 3) As earnings revisions are strongly correlated to PMIs, contracting PMI (48.4 in December) indicates that earnings estimates might be susceptible to further downgrades.
Inflation: Peaking inflation continued to be a silver lining for the equity market, with headline consumer price index and core consumer inflation falling to 6.5% and 5.7%, respectively, on a year-ago basis, the slowest pace in over a year. We expect inflation to moderate further this year, but our view is that U.S. inflation will likely settle closer to 3% (versus the Fed’s 2% target). Also, the pressures from a tight labor market might keep elevated inflation stick around longer than investors have expected. Our wage index shows that wage inflation moderated in December but remained high at 5.7% YOY.
Federal Reserve Policy: We expect monetary policy uncertainty remains high despite the slowing pace of rate hikes. Inflation has peaked but will likely stay above target; thus, Fed needs tight financial conditions to keep growth below trend. We anticipate a peak fed funds rate of about 5% (a 25bp hike in February and possibly another 25bp in March) and remain there for a while.
|
|
As of 1/31/23. Data provided by Bloomberg, NorthCoast Asset Management, Federal Reserve History. 1 The NorthCoast Navigator is a market barometer displaying NorthCoast's current U.S. and international equity exposure and outlook. This aggregate metric is determined by multiple data points across four broad market-moving dimensions: Technical, Sentiment, Macroeconomic, and Valuation. The daily result determines equity exposure in our tactical strategies.
NorthCoast Asset Management is a d/b/a of, and investment advisory services are offered through, Connectus Wealth, LLC, an investment adviser registered with the United States Securities and Exchange Commission (SEC). Registration with the SEC or any state securities authority does not imply a certain level of skill or training. More information about Connectus can be found at www.connectuswealth.com.
NorthCoast and its affiliates do not provide tax, legal or accounting advice. This material has been prepared for informational purposes only, and is not intended to provide, and should not be relied on for, tax, legal or accounting advice. You should consult your own tax, legal and accounting advisors before engaging in any transaction.
The information contained herein has been prepared by NorthCoast Asset Management ("NorthCoast") on the basis of publicly available information, internally developed data and other third party sources believed to be reliable. NorthCoast has not sought to independently verify information obtained from public and third party sources and makes no representations or warranties as to accuracy, completeness or reliability of such information. All opinions and views constitute judgments as of the date of writing without regard to the date on which the reader may receive or access the information, and are subject to change at any time without notice and with no obligation to update. This material is for informational and illustrative purposes only and is intended solely for the information of those to whom it is distributed by NorthCoast. No part of this material may be reproduced or retransmitted in any manner without the prior written permission of NorthCoast. NorthCoast does not represent, warrant or guarantee that this information is suitable for any investment purpose and it should not be used as a basis for investment decisions. © 2022 NorthCoast Asset Management.
PAST PERFORMANCE DOES NOT GUARANTEE OR INDICATE FUTURE RESULTS.
This material should not be viewed as a current or past recommendation or a solicitation of an offer to buy or sell any securities or investment products or to adopt any investment strategy. The reader should not assume that any investments in companies, securities, sectors, strategies and/or markets identified or described herein were or will be profitable and no representation is made that any investor will or is likely to achieve results comparable to those shown or will make any profit or will be able to avoid incurring substantial losses. Performance differences for certain investors may occur due to various factors, including timing of investment. Investment return will fluctuate and may be volatile, especially over short time horizons.
INVESTING ENTAILS RISKS, INCLUDING POSSIBLE LOSS OF SOME OR ALL OF THE INVESTOR'S PRINCIPAL.
The investment views and market opinions/analyses expressed herein may not reflect those of NorthCoast as a whole and different views may be expressed based on different investment styles, objectives, views or philosophies. To the extent that these materials contain statements about the future, such statements are forward looking and subject to a number of risks and uncertainties.
|