
What happened in June?
June by the numbers:
U.S. Equities | S&P 500: 7.0%
International Equities | ACWI ex-U.S.: 6.0%
U.S. Bonds | Barclays U.S. Aggregate Bond Index: 1.3%
Global Bonds | JP Morgan Global Aggregate Bond Index: 2.0%
Moving into July
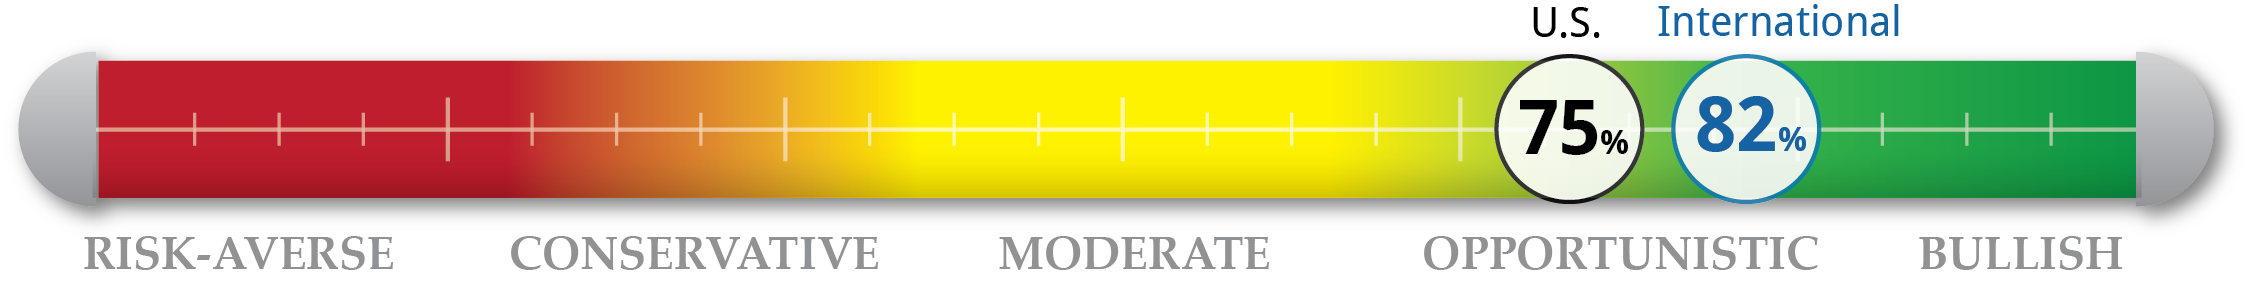
The second quarter was dominated by geopolitical headlines that drove volatility. Most of these headlines revolved around trade and the Federal Reserve, which are related at the moment. A good outcome from the G-20 meeting should be a positive sign for the economy but could lessen the chance that the Fed cuts rates. Initial reports from the G-20 detail some thawing of trade talks and that discussions should resume. Continued news from these discussions and upcoming earnings reports are likely to drive some market action in the coming weeks. At the end of June, we are 75% invested in our tactical U.S. strategy and 82% in our international tactical strategy. Stronger international valuation indicators are driving the higher investment level.
NorthCoast Navigator
|
Negative Indicators |
Positive Indicators |
|
|
|
Valuation The upswing in June brought valuations back to April levels and indicators appear stretched once again. P/E ratios sit at 17.7. Valuation indicators have been the laggards this year. There will be more clarity on these indicators with upcoming earnings reports. |
Macroeconomic There is still some uncertainty surrounding the economic outlook despite trade discussions resuming. The current economic state is rosy, however, as unemployment remains extremely low and inflation appears to be recovering. Household spending and income also rose in May. |
Sentiment Sentiment declined slightly in June as the University of Michigan sentiment survey moved to 98.2 from 100. Indicators still remain elevated and the 98.2 reading was above June estimates. Any decline in sentiment at the moment appears to be driven by uncertainty about the future because current conditions for consumers are strong.
|
Technical The major turnaround in market action from May negatively impacted reversal indicators as expected, but momentum benefited from the strong June. The S&P 500 also moved higher above its moving averages and currently sits 2%, 3% and 6% above the 50, 100 and 200-day moving averages, respectively.
|