
What happened in April?
April by the numbers:
U.S. Equities | S&P 500: 4.0%
International Equities | ACWI ex-U.S.: 2.6%
U.S. Bonds | Barclays U.S. Aggregate Bond Index: 0.0%
Global Bonds | JP Morgan Global Aggregate Bond Index: -0.2%
Moving into May
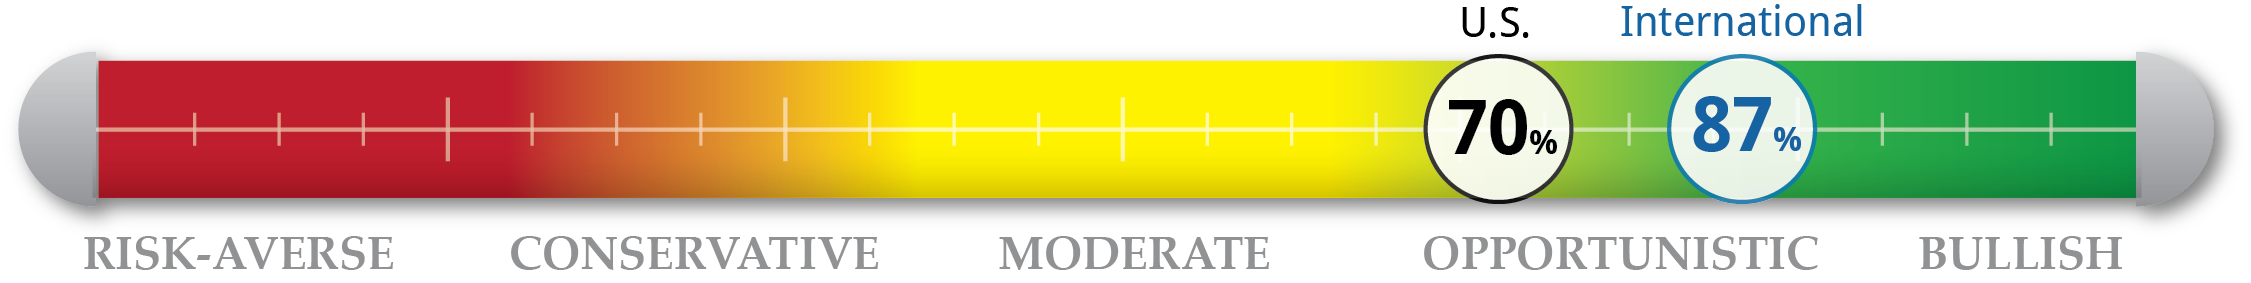
There is no guarantee that the U.S. and China will reach an agreement in the next two months or at all. It is likely that the market has already digested the positive news from last month and in the event of a breakdown in discussions at this point, market volatility would very likely spike. Progress has stalled previously during these negotiations, but a falter at this point may have more negative impacts than before on investors and the chances of an agreement. The U.S. Federal Reserve’s meeting in May could help shine further light on their patient stance as they digest the most recent positive economic news. Moving into May we are 70% invested in our U.S. tactical strategy as valuation indicators have depressed further as other indicators are holding relatively steady. Technical indicators lead the way for our international tactical strategy and valuations look significantly more positive relative to the U.S. We are 87% invested in the international tactical strategy.
NorthCoast Navigator
|
Negative Indicators |
Neutral Indicators |
|
Positive Indicators |
|
Valuation With the U.S. equity market continuing its positive run this year and hitting new highs in April, valuations have stretched further. P/E ratios sit at 19.3 showing that U.S. equities are relatively expensive assets. |
Macroeconomic GDP growth rate for Q1 2019 came in above expectations at 3.2%. Consumer spending increased in February and March but were below the expected growth rates. Inflation in March was 1.5%. 2% inflation is the Fed’s target for healthy economic growth. |
Sentiment Sentiment indicators remained steady last month with little change. The University of Michigan consumer sentiment survey dropped slightly, but the Conference Board’s index of U.S. Consumer confidence rose marginally.
|
Technical Fresh highs mean the S&P 500 rose further above its 50, 100 and 200-day moving averages. Momentum also strengthened shown by the Relative Strength Index rising 8 points relative to the end of March. The VIX decreased further from March to 13.1. |