Overview
Since October 1, the market has declined approximately 8% off its all-time highs. Our portfolio management team has provided three (3) key elements to the recent correction and what it possibly means moving forward.
1. Putting the recent pullback into perspective
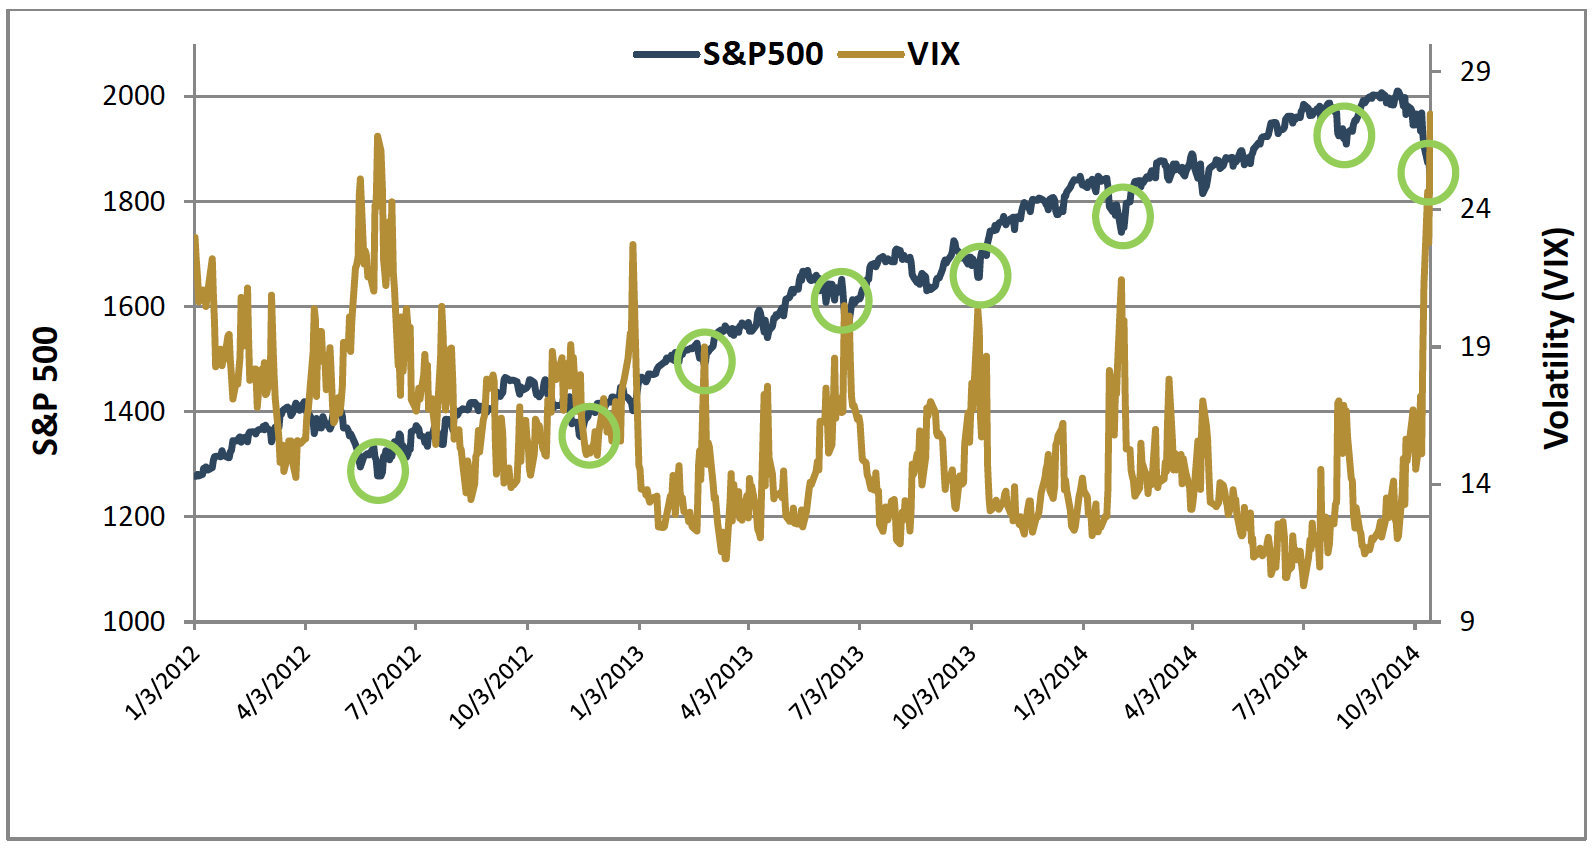
The VIX Index (~ fear Index) is at its highest point over the past two years and makes incursions into this territory about once per quarter. In each instance, the market pulled back before resuming its ascent once the fear subsided and the VIX came back to a normal level.
This specific metric is part of our cash scaling model.
2. “Gut Feeling” investing can be harmful - rely on a data-researched investment process
Selling when the market is going down and buying when the market is going up is a technician’s approach to the market. The problem with a technicals-only approach is that it often has an investor selling at short lows and buying at short highs. As explored in our cash scaling whitepaper, this simple trading rule has substantially trailed the market over the past 24 years, even when fine-tuning the parameters. (http://www.northcoastam.com/whitepaper-cash-scaling.pdf)
The table below highlights the cumulative return difference over a 24 year period between a simple tactical investment rule and the S&P 500.
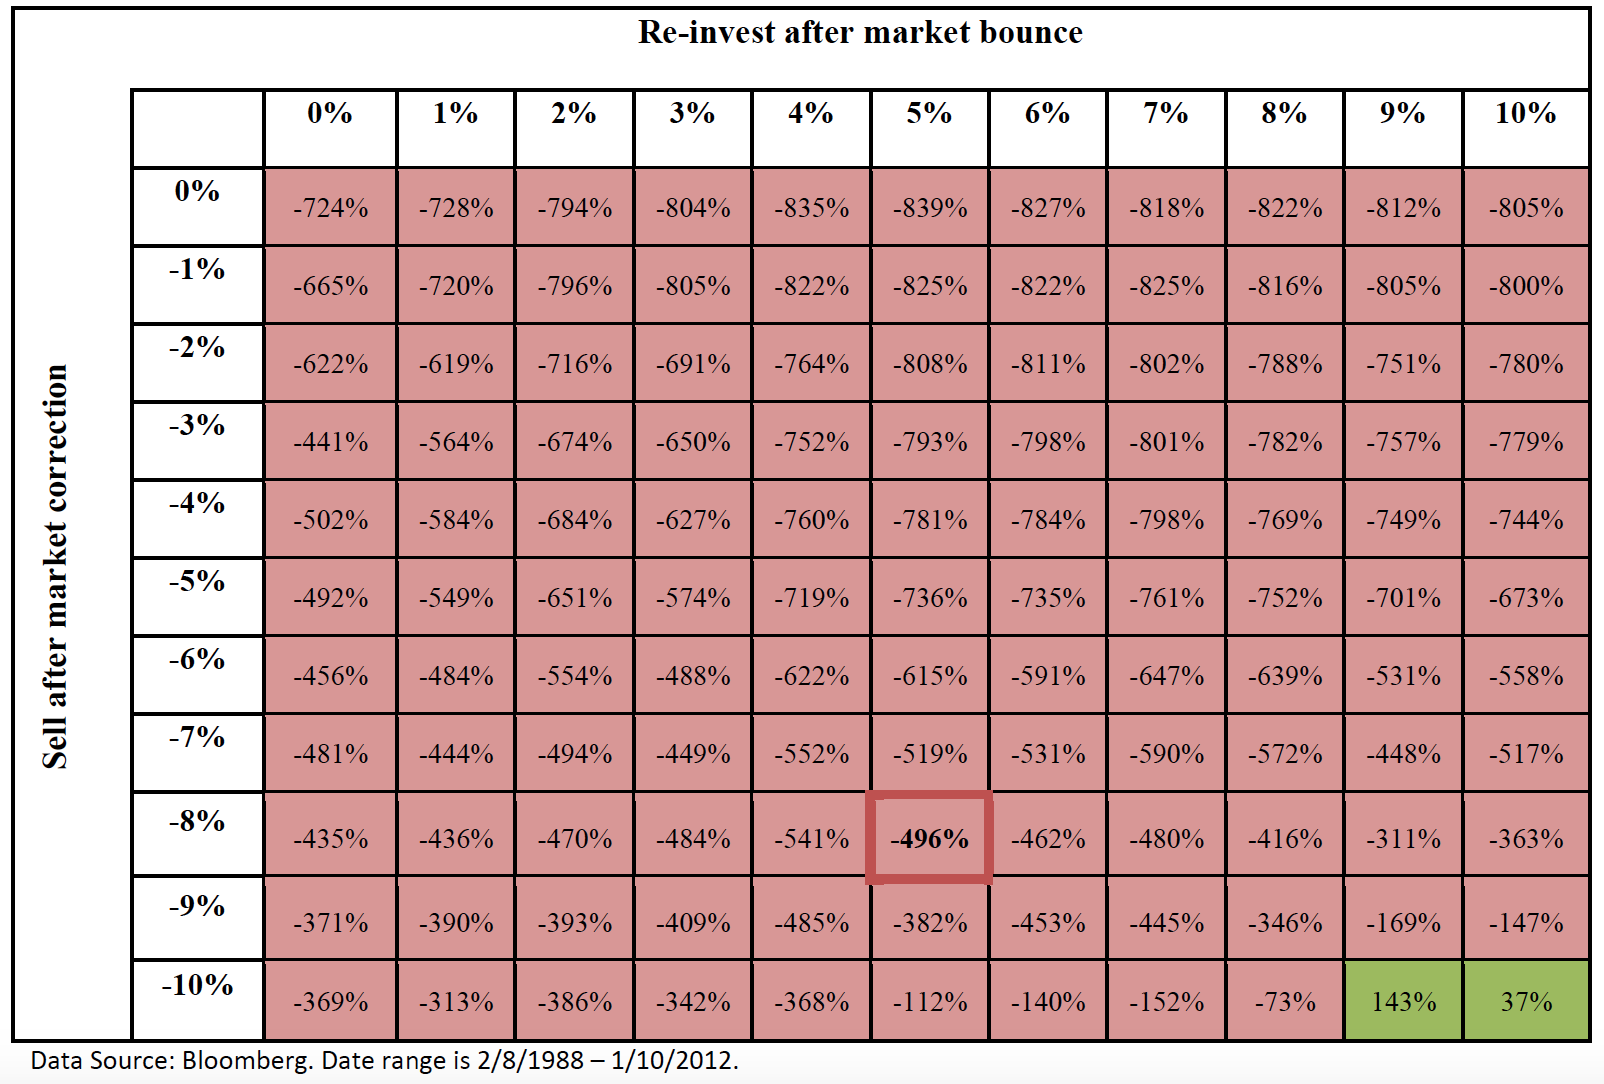
Buying-and-holding the S&P 500 over this timeframe would have garnered a portfolio return of +787%.
The table highlights the negative impact of “timing” the market with structured sell-stop and buy-back investment rules.
*For example, if you were to invest into the S&P 500 index fund and sell each time it corrected -8% then bought back in after a +5% rally; your performance would significantly trail a “buy-and-hold” method over that same time period by 496%.
3. Forward Looking
Investing is never without risk and will experience pockets of volatility. The most critical decision when managing a portfolio for the long term is to choose a well-researched, sound investment methodology and to apply it consistently.
Market Outlook:
We are monitoring the data across four broad dimensions (Valuation, Macroeconomic, Technical, and Sentiment) to generate an informed opinion on the market outlook. Valuation is now neutral (from slightly negative), Macroeconomic and Technical indicators are strongly positive, while Sentiment is slightly positive. The current decline can be characterized as a “healthy correction”, a roughly 10% pullback that occurs, on average, at least once per year. It is providing more attractive entry points.
You can point to recent history where similar declines occurred – April 2012, October 2012, June 2013, January 2014, and July 2014. All were short-term corrections, eventually leading to new market highs. Even more so, the decline in August/September 2011 led to an S&P 500 rally of +20.3% in a two-week timeframe (10/4/11-10/27/11).
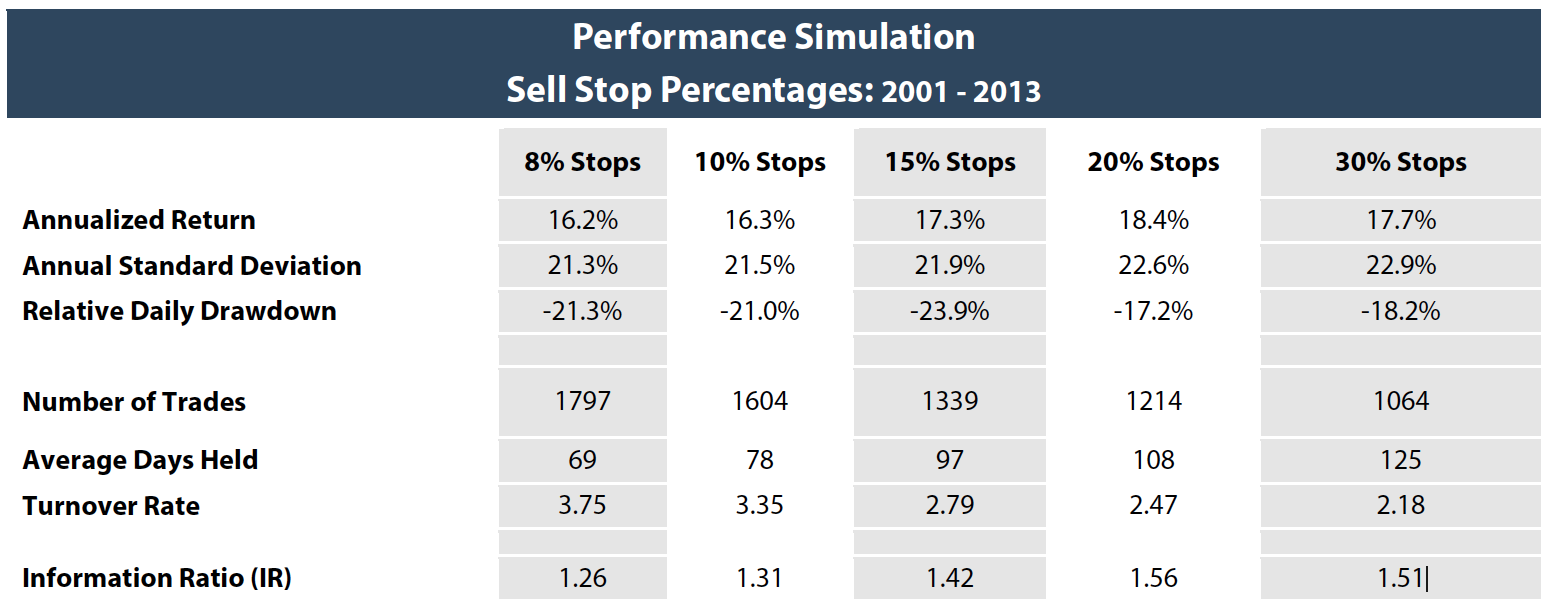
Sell Stops:
Volatility is different today than it was 30 years ago. Portfolio diversification allows individual stocks more flexibility without significant portfolio performance impact (A key reason our stock portfolios hold approximately 30 positions, with position weights between 2-4%) . Overtime, wider stops lead to higher annual rate return with enhanced risk metrics. The table below highlights the performance differences overtime by executing sell-stops at different percentages.
Past performance is not indicative of future results. All investments involve risk, including loss of principal.
This material serves to provide general information and is not meant to be legal or tax advice for any particular investor, which can only be provided by qualified tax and legal counsel. Parties should independently investigate any investment strategy or manager, and should consult with their financial adviser, legal and tax professionals before making any investment. The information herein is subject to change, without notice, at the discretion of the NorthCoast and NorthCoast does not undertake to revise or update this information in any way. No investment process is free of risk and there is no guarantee that the investment programs described herein will be profitable. Benchmarks referenced herein are broad-based indices which are used for comparative purposes only and have been selected as they are well known and are easily recognizable by investors.
Certain information contained herein may have been provided by third party sources and, although believed to be reliable, has not been independently verified and its accuracy or completeness cannot be guaranteed. All information contained herein should be independently verified and confirmed. NCAM does not accept any liability for any loss or damage whatsoever caused in reliance upon such information.
The information in this document is confidential, intended only for the person to whom it has been delivered and under no circumstances may a copy be shown, copied, transmitted or otherwise given to any person other than the authorized recipient or their tax or legal counsel without the prior written consent NorthCoast Asset Management.
NorthCoast Asset Management is a registered investment adviser. Information presented is for educational purposes only. It should not be considered specific investment advice, does not take into consideration your specific situation, and does not intend to make an offer or solicitation for the sale or purchase of any securities or investment strategies. Investments involve risk and are not guaranteed. Be sure to consult with a qualified financial adviser and/or tax professional before implementing any strategy discussed herein. Registration does not imply a certain level of skill or training.