
What happened in January?
U.S. equities got off to a strong start in 2018 as the three major domestic indexes hit new highs in January before drawing back at the end of the month. Despite the strong numbers, rising bond yields (the 10-year Treasury note hit its highest yield since April 2014) and large intraday declines in the final days of the month raised concerns over the sustainability of such a high-priced market. Volatility in the U.S. also picked up in January with the VIX hitting a five-month high. With over half of the companies in the S&P 500 having reported, 81% beat analysts’ estimates helping to push the S&P 500 to monthly gains on the final trading day of the month.
Across the globe, French GDP rebounded significantly last year growing at its fastest rate since 2011 and boosting Eurozone GDP growth. Often an economic laggard, France’s reemergence is a positive macroeconomic indicator for the Eurozone. Emerging markets continued their positive run into 2018, boosted by a weak dollar, globally low bond yields and increasing flows of investments from around the globe.
January by the numbers:
U.S. Euities | S&P 500: +5.7%
International Equities | ACWI ex-U.S.: +5.6%
U.S. Bonds | Barclays U.S. Aggregate Bond Index: -1.2%
Global Bonds | JP Morgan Global Aggregate Bond Index: +0.7%
Moving into February
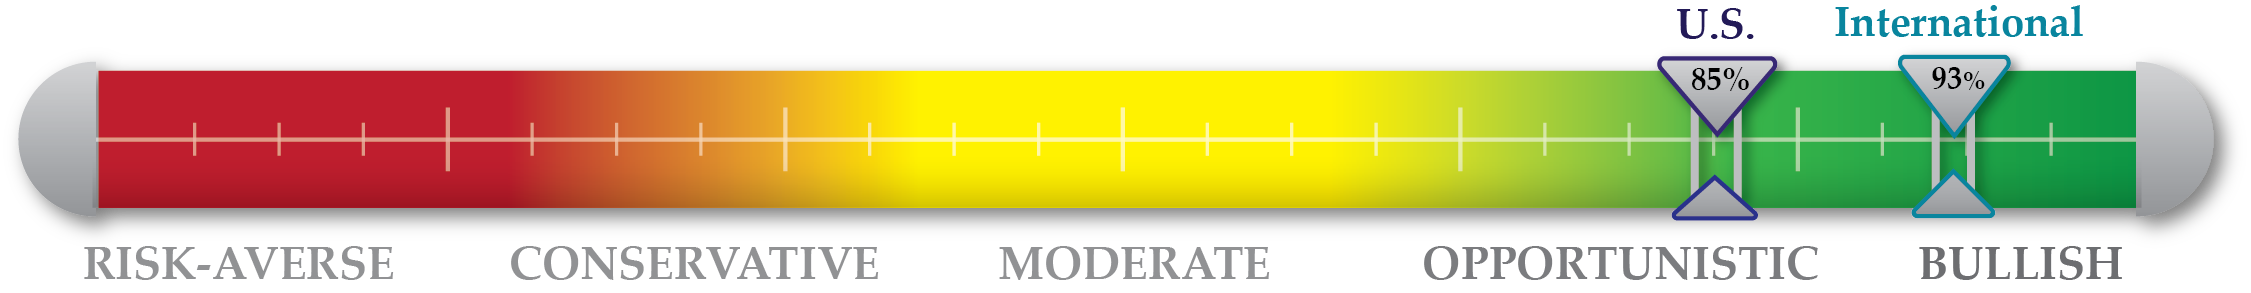
January saw both a very hot start to the year for equities as well as the largest daily decline since August of last year. 2017 was characterized by low volatility but 2018 has already begun to buck that trend. Low yields have been supporting the sky-high equity valuations but, as these bond yields increase, their impact on global equities will be a closely watched factor moving forward. With the early risks of 2018 beginning to take shape, we stand opportunistic in domestic markets and cautiously optimistic internationally. We enter February 85% invested in our U.S. tactical strategies and 93% invested in our international tactical strategies.
NorthCoast Navigator

|
Negative Indicators |
Positive Indicators |
|
|
|
Valuation The S&P 500 hit new highs once again in January as equity valuations stretched further. The 12-month trailing P/E ratio rose above 23 for the first time since 2010. |
Technical The 30-day relative strength index rose in January as the S&P 500 moved 12%, 8% and 4% above its 200-day, 100-day and 50-day moving averages respectively |
Macroeconomic Wage growth ticked up in 2017 as employment costs for employers increased at its fastest pace since 2008. Leading economic indicators retained their strength in January. |
Sentiment The Bull/Bear ratio dropped slightly from the end of 2017, but maintains a very high level near 2. Investment into S&P 500 index funds reached their highest level in over a year. |