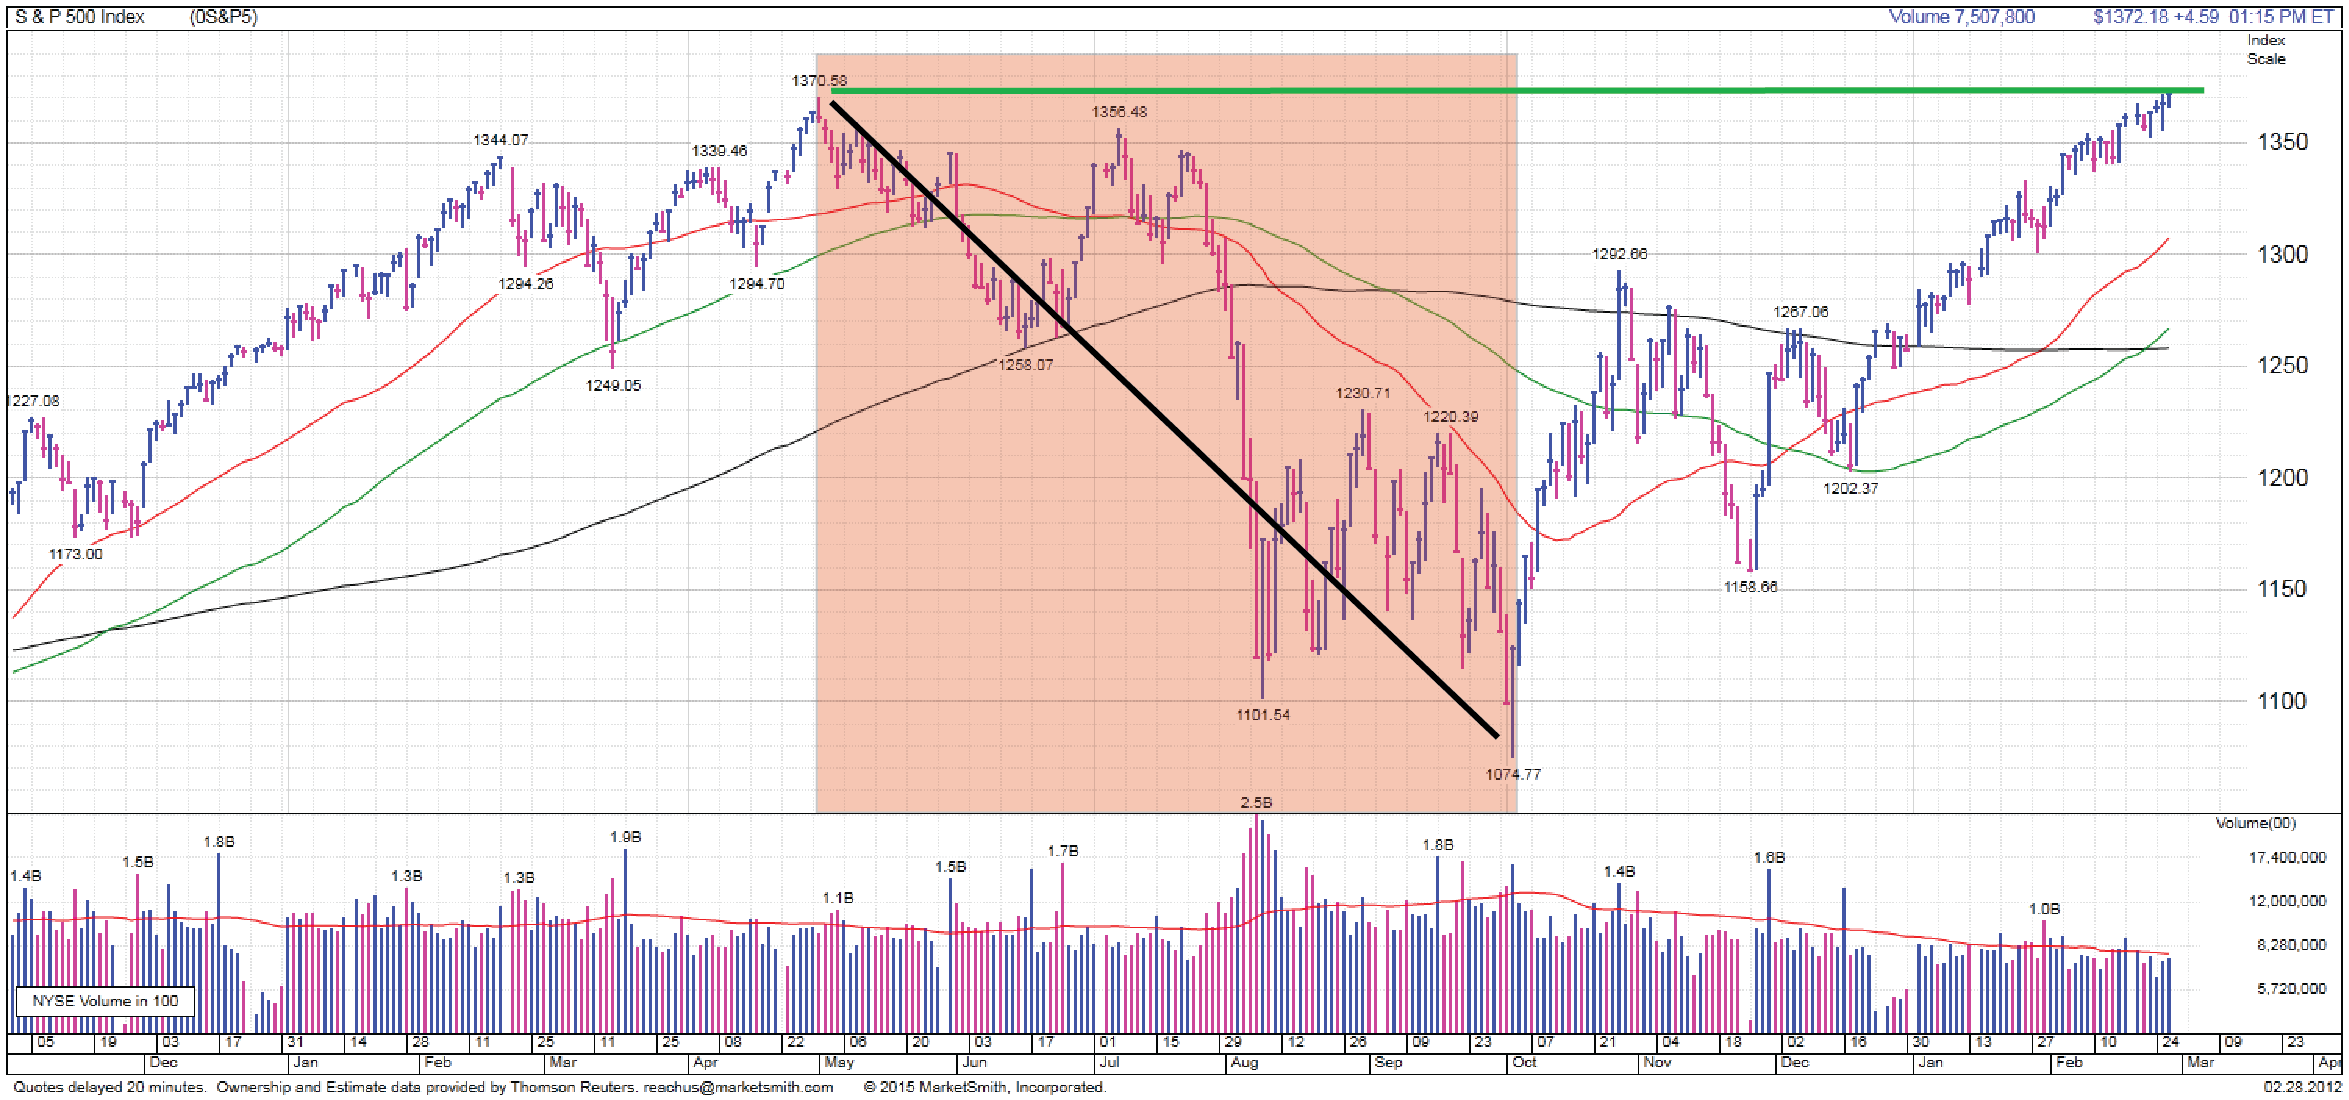
In the midst of the stock market's swoon, it's important to keep things in perspective. Let's look back at recent history:
Does 7/7/11 – 10/4/11 look that scary now? -20.8% peak to trough (drawdown) on S&P 500 over a 3-month period... It traded higher by the end of February 2012.
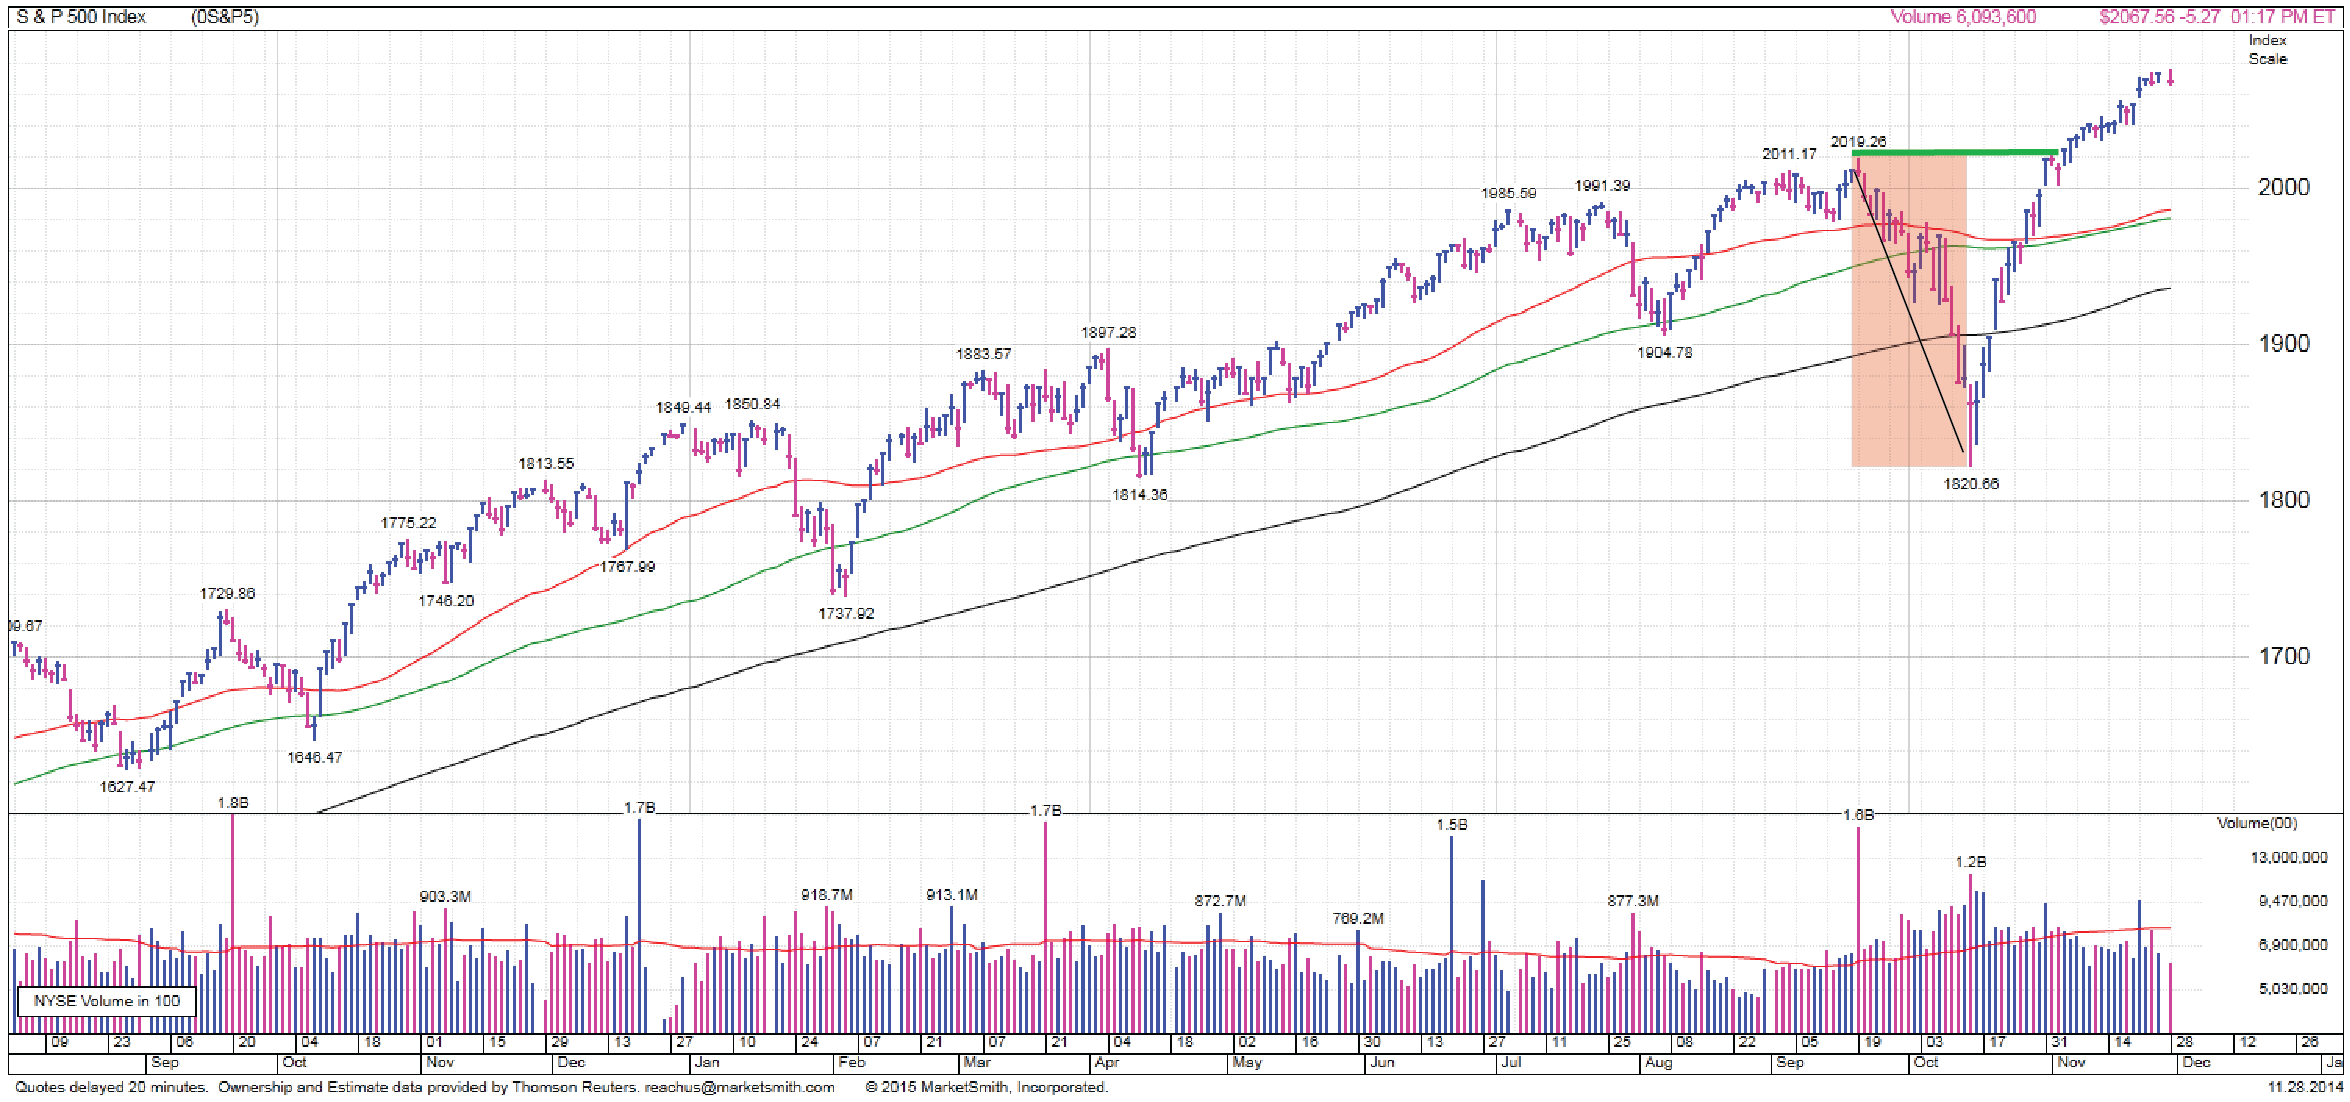
What about the October 2014 correction, 9/19/14 – 10/15/14? Does that look scary now? -9.4% peak to trough... Traded higher by mid-November 2014.
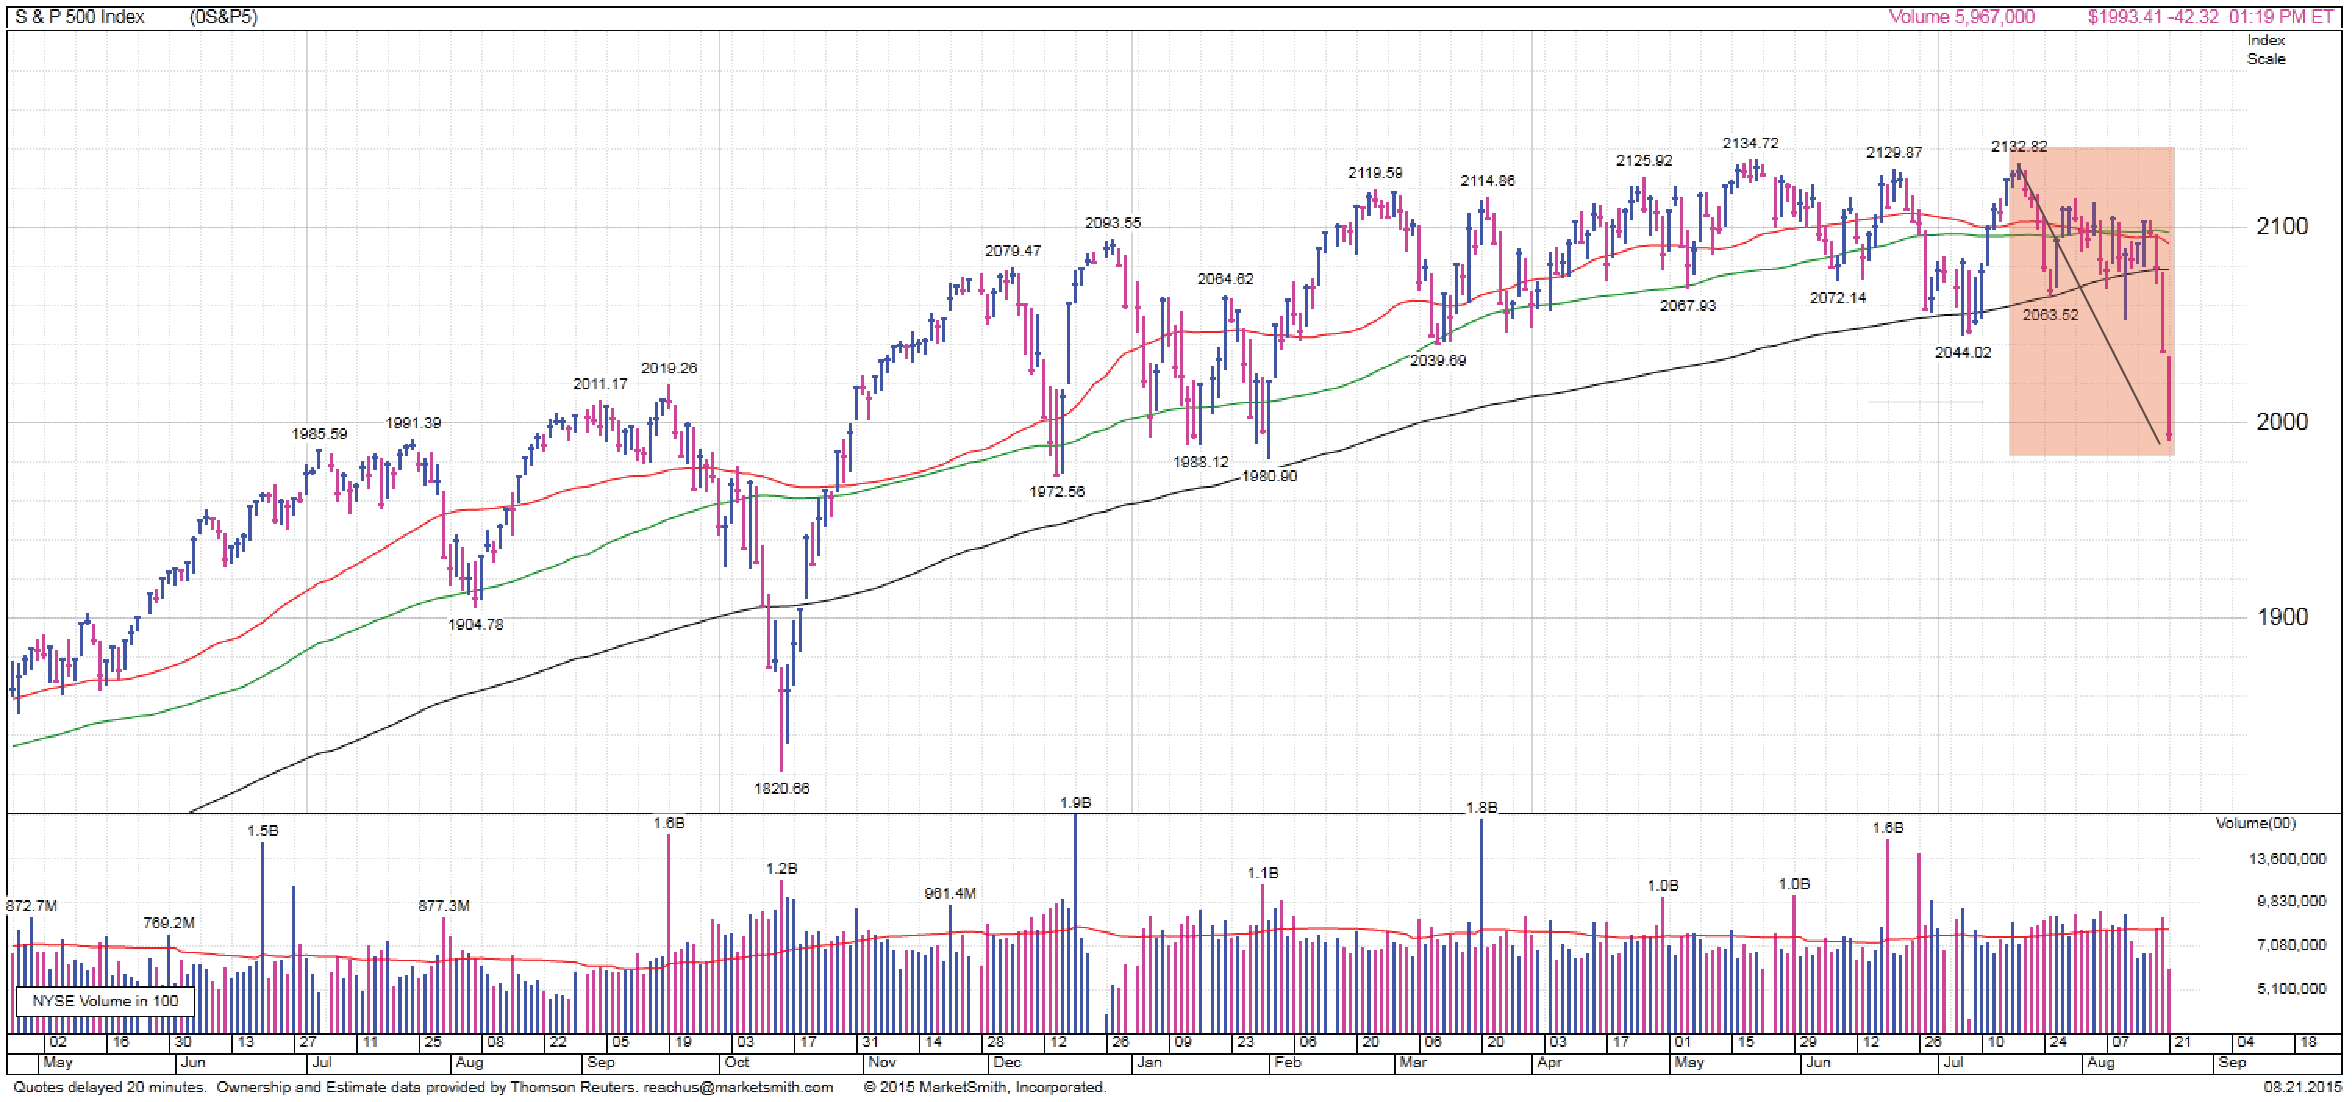
We're currently in a -6% pullback (at the time of writing). Of course it feels scary as you work through these corrections, but it is how one makes money. Without fear there would be no premium return to owning stocks.
The metrics we watch regarding market exposure (Macroeconomic, Sentiment, Valuation, and Technical Indicators) continue to paint a bullish picture and should signal to our clients to add money. We will continue to monitor the market activity daily and adjust as necessary.